Hierarchical Clusters
Displaying 301 - 400 of 7500
| Title | Cluster Plot | Dendrogram | e-value | e-value | e-value | Condition | Condition FDR | Condition Difference |
|---|---|---|---|---|---|---|---|---|
| Thaps_hclust_0480 |
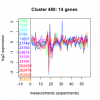 |
 |
0.18 |
1.3 |
44 |
diel_light_vs_dark | 0.959000 | 0.0207 |
| Thaps_hclust_0480 |
 |
 |
0.18 |
1.3 |
44 |
lowFe_KTKB_Day3 | 0.604000 | 0.163 |
| Thaps_hclust_0480 |
 |
 |
0.18 |
1.3 |
44 |
lowFe_KTKB_Day5 | 0.111000 | 0.392 |
| Thaps_hclust_0480 |
 |
 |
0.18 |
1.3 |
44 |
BaP | 0.016300 | -0.596 |
| Thaps_hclust_0480 |
 |
 |
0.18 |
1.3 |
44 |
exponential_vs_stationary_24highlight | 0.578000 | 0.0792 |
| Thaps_hclust_0480 |
 |
 |
0.18 |
1.3 |
44 |
co2_elevated_stat_arrays | 0.278000 | -0.282 |
| Thaps_hclust_0480 |
 |
 |
0.18 |
1.3 |
44 |
lowtemp_TMEVA | 0.646000 | 0.145 |
| Thaps_hclust_0480 |
 |
 |
0.18 |
1.3 |
44 |
highpH_TMEVA | 0.664000 | 0.0937 |
| Thaps_hclust_0480 |
 |
 |
0.18 |
1.3 |
44 |
co2_elevated_expo_arrays | 0.980000 | 0.0183 |
| Thaps_hclust_0480 |
 |
 |
0.18 |
1.3 |
44 |
lowFe_TMEVA | 0.736000 | 0.135 |
| Thaps_hclust_0480 |
 |
 |
0.18 |
1.3 |
44 |
exponential_vs_stationary_24light | 0.900000 | 0.0573 |
| Thaps_hclust_0480 |
 |
 |
0.18 |
1.3 |
44 |
lowN_TMEVA | 0.730000 | 0.145 |
| Thaps_hclust_0480 |
 |
 |
0.18 |
1.3 |
44 |
diel_exponential_vs_stationary | 0.863000 | -0.048 |
| Thaps_hclust_0480 |
 |
 |
0.18 |
1.3 |
44 |
lowSi_TMEVA | 0.997000 | -0.0876 |
| Thaps_hclust_0480 |
 |
 |
0.18 |
1.3 |
44 |
highlight_arrays | 0.750000 | 0.0689 |
| Title | Cluster Plot | Dendrogram | e-value | e-value | e-value | Condition | Condition FDR | Condition Difference |
|---|---|---|---|---|---|---|---|---|
| Thaps_hclust_0479 |
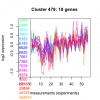 |
 |
0.11 |
0.2 |
1.5 |
highlight_arrays | 0.554000 | -0.109 |
| Thaps_hclust_0479 |
 |
 |
0.11 |
0.2 |
1.5 |
diel_light_vs_dark | 0.731000 | 0.0972 |
| Thaps_hclust_0479 |
 |
 |
0.11 |
0.2 |
1.5 |
lowFe_KTKB_Day3 | 0.795000 | -0.079 |
| Thaps_hclust_0479 |
 |
 |
0.11 |
0.2 |
1.5 |
lowFe_KTKB_Day5 | 1.000000 | 0.000526 |
| Thaps_hclust_0479 |
 |
 |
0.11 |
0.2 |
1.5 |
BaP | 0.016400 | -0.537 |
| Thaps_hclust_0479 |
 |
 |
0.11 |
0.2 |
1.5 |
exponential_vs_stationary_24highlight | 0.899000 | -0.0186 |
| Thaps_hclust_0479 |
 |
 |
0.11 |
0.2 |
1.5 |
co2_elevated_stat_arrays | 0.072900 | -0.408 |
| Thaps_hclust_0479 |
 |
 |
0.11 |
0.2 |
1.5 |
lowtemp_TMEVA | 0.745000 | 0.0966 |
| Thaps_hclust_0479 |
 |
 |
0.11 |
0.2 |
1.5 |
highpH_TMEVA | 0.984000 | -0.00683 |
| Thaps_hclust_0479 |
 |
 |
0.11 |
0.2 |
1.5 |
co2_elevated_expo_arrays | 0.943000 | -0.0399 |
| Thaps_hclust_0479 |
 |
 |
0.11 |
0.2 |
1.5 |
lowFe_TMEVA | 0.733000 | -0.127 |
| Thaps_hclust_0479 |
 |
 |
0.11 |
0.2 |
1.5 |
exponential_vs_stationary_24light | 0.963000 | -0.0208 |
| Thaps_hclust_0479 |
 |
 |
0.11 |
0.2 |
1.5 |
lowN_TMEVA | 0.861000 | 0.0641 |
| Thaps_hclust_0479 |
 |
 |
0.11 |
0.2 |
1.5 |
diel_exponential_vs_stationary | 0.775000 | -0.0661 |
| Thaps_hclust_0479 |
 |
 |
0.11 |
0.2 |
1.5 |
lowSi_TMEVA | 1.000000 | -0.00149 |
| Title | Cluster Plot | Dendrogram | e-value | e-value | e-value | Condition | Condition FDR | Condition Difference |
|---|---|---|---|---|---|---|---|---|
| Thaps_hclust_0478 |
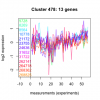 |
 |
0.1 |
0.0096 |
3.5 |
lowSi_TMEVA | 0.707000 | -0.308 |
| Thaps_hclust_0478 |
 |
 |
0.1 |
0.0096 |
3.5 |
highlight_arrays | 0.241000 | -0.231 |
| Thaps_hclust_0478 |
 |
 |
0.1 |
0.0096 |
3.5 |
diel_light_vs_dark | 0.288000 | 0.283 |
| Thaps_hclust_0478 |
 |
 |
0.1 |
0.0096 |
3.5 |
lowFe_KTKB_Day3 | 0.954000 | -0.0209 |
| Thaps_hclust_0478 |
 |
 |
0.1 |
0.0096 |
3.5 |
lowFe_KTKB_Day5 | 0.552000 | 0.161 |
| Thaps_hclust_0478 |
 |
 |
0.1 |
0.0096 |
3.5 |
BaP | 0.021300 | -0.605 |
| Thaps_hclust_0478 |
 |
 |
0.1 |
0.0096 |
3.5 |
exponential_vs_stationary_24highlight | 0.902000 | -0.0201 |
| Thaps_hclust_0478 |
 |
 |
0.1 |
0.0096 |
3.5 |
co2_elevated_stat_arrays | 0.697000 | -0.113 |
| Thaps_hclust_0478 |
 |
 |
0.1 |
0.0096 |
3.5 |
lowtemp_TMEVA | 0.695000 | 0.133 |
| Thaps_hclust_0478 |
 |
 |
0.1 |
0.0096 |
3.5 |
highpH_TMEVA | 0.072300 | -0.35 |
| Thaps_hclust_0478 |
 |
 |
0.1 |
0.0096 |
3.5 |
co2_elevated_expo_arrays | 0.786000 | 0.0957 |
| Thaps_hclust_0478 |
 |
 |
0.1 |
0.0096 |
3.5 |
lowFe_TMEVA | 0.580000 | -0.194 |
| Thaps_hclust_0478 |
 |
 |
0.1 |
0.0096 |
3.5 |
exponential_vs_stationary_24light | 0.862000 | -0.0838 |
| Thaps_hclust_0478 |
 |
 |
0.1 |
0.0096 |
3.5 |
lowN_TMEVA | 0.607000 | 0.212 |
| Thaps_hclust_0478 |
 |
 |
0.1 |
0.0096 |
3.5 |
diel_exponential_vs_stationary | 0.241000 | -0.269 |
| Title | Cluster Plot | Dendrogram | e-value | e-value | e-value | Condition | Condition FDR | Condition Difference |
|---|---|---|---|---|---|---|---|---|
| Thaps_hclust_0477 |
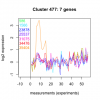 |
 |
0.02 |
0.011 |
0.071 |
diel_exponential_vs_stationary | 0.982000 | -0.00961 |
| Thaps_hclust_0477 |
 |
 |
0.02 |
0.011 |
0.071 |
lowSi_TMEVA | 0.976000 | -0.112 |
| Thaps_hclust_0477 |
 |
 |
0.02 |
0.011 |
0.071 |
highlight_arrays | 0.435000 | -0.21 |
| Thaps_hclust_0477 |
 |
 |
0.02 |
0.011 |
0.071 |
diel_light_vs_dark | 0.856000 | -0.0868 |
| Thaps_hclust_0477 |
 |
 |
0.02 |
0.011 |
0.071 |
lowFe_KTKB_Day3 | 0.335000 | -0.389 |
| Thaps_hclust_0477 |
 |
 |
0.02 |
0.011 |
0.071 |
lowFe_KTKB_Day5 | 0.748000 | -0.116 |
| Thaps_hclust_0477 |
 |
 |
0.02 |
0.011 |
0.071 |
BaP | 0.562000 | -0.228 |
| Thaps_hclust_0477 |
 |
 |
0.02 |
0.011 |
0.071 |
exponential_vs_stationary_24highlight | 0.657000 | -0.0844 |
| Thaps_hclust_0477 |
 |
 |
0.02 |
0.011 |
0.071 |
co2_elevated_stat_arrays | 0.154000 | -0.467 |
| Thaps_hclust_0477 |
 |
 |
0.02 |
0.011 |
0.071 |
lowtemp_TMEVA | 0.784000 | 0.126 |
| Thaps_hclust_0477 |
 |
 |
0.02 |
0.011 |
0.071 |
highpH_TMEVA | 0.466000 | -0.188 |
| Thaps_hclust_0477 |
 |
 |
0.02 |
0.011 |
0.071 |
co2_elevated_expo_arrays | 0.934000 | -0.0516 |
| Thaps_hclust_0477 |
 |
 |
0.02 |
0.011 |
0.071 |
lowFe_TMEVA | 0.416000 | -0.33 |
| Thaps_hclust_0477 |
 |
 |
0.02 |
0.011 |
0.071 |
exponential_vs_stationary_24light | 0.728000 | -0.204 |
| Thaps_hclust_0477 |
 |
 |
0.02 |
0.011 |
0.071 |
lowN_TMEVA | 0.855000 | 0.0905 |
| Title | Cluster Plot | Dendrogram | e-value | e-value | e-value | Condition | Condition FDR | Condition Difference |
|---|---|---|---|---|---|---|---|---|
| Thaps_hclust_0476 |
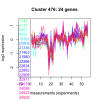 |
 |
0.0015 |
0.56 |
2.4 |
lowN_TMEVA | 0.440000 | -0.261 |
| Thaps_hclust_0476 |
 |
 |
0.0015 |
0.56 |
2.4 |
diel_exponential_vs_stationary | 0.533000 | -0.118 |
| Thaps_hclust_0476 |
 |
 |
0.0015 |
0.56 |
2.4 |
lowSi_TMEVA | 1.000000 | 0.049 |
| Thaps_hclust_0476 |
 |
 |
0.0015 |
0.56 |
2.4 |
highlight_arrays | 0.498000 | -0.105 |
| Thaps_hclust_0476 |
 |
 |
0.0015 |
0.56 |
2.4 |
diel_light_vs_dark | 0.628000 | 0.115 |
| Thaps_hclust_0476 |
 |
 |
0.0015 |
0.56 |
2.4 |
lowFe_KTKB_Day3 | 0.926000 | -0.0249 |
| Thaps_hclust_0476 |
 |
 |
0.0015 |
0.56 |
2.4 |
lowFe_KTKB_Day5 | 0.015400 | -0.418 |
| Thaps_hclust_0476 |
 |
 |
0.0015 |
0.56 |
2.4 |
BaP | 0.000370 | -0.953 |
| Thaps_hclust_0476 |
 |
 |
0.0015 |
0.56 |
2.4 |
exponential_vs_stationary_24highlight | 0.250000 | 0.115 |
| Thaps_hclust_0476 |
 |
 |
0.0015 |
0.56 |
2.4 |
co2_elevated_stat_arrays | 0.680000 | -0.111 |
| Thaps_hclust_0476 |
 |
 |
0.0015 |
0.56 |
2.4 |
lowtemp_TMEVA | 0.247000 | -0.275 |
| Thaps_hclust_0476 |
 |
 |
0.0015 |
0.56 |
2.4 |
highpH_TMEVA | 0.781000 | -0.0511 |
| Thaps_hclust_0476 |
 |
 |
0.0015 |
0.56 |
2.4 |
co2_elevated_expo_arrays | 0.464000 | -0.136 |
| Thaps_hclust_0476 |
 |
 |
0.0015 |
0.56 |
2.4 |
lowFe_TMEVA | 0.853000 | -0.0785 |
| Thaps_hclust_0476 |
 |
 |
0.0015 |
0.56 |
2.4 |
exponential_vs_stationary_24light | 0.902000 | 0.0402 |
| Title | Cluster Plot | Dendrogram | e-value | e-value | e-value | Condition | Condition FDR | Condition Difference |
|---|---|---|---|---|---|---|---|---|
| Thaps_hclust_0475 |
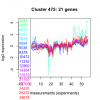 |
 |
0.011 |
0.95 |
0.77 |
lowN_TMEVA | 0.614000 | 0.187 |
| Thaps_hclust_0475 |
 |
 |
0.011 |
0.95 |
0.77 |
diel_exponential_vs_stationary | 0.389000 | -0.164 |
| Thaps_hclust_0475 |
 |
 |
0.011 |
0.95 |
0.77 |
lowSi_TMEVA | 0.956000 | 0.154 |
| Thaps_hclust_0475 |
 |
 |
0.011 |
0.95 |
0.77 |
highlight_arrays | 0.790000 | 0.0493 |
| Thaps_hclust_0475 |
 |
 |
0.011 |
0.95 |
0.77 |
diel_light_vs_dark | 0.137000 | 0.297 |
| Thaps_hclust_0475 |
 |
 |
0.011 |
0.95 |
0.77 |
lowFe_KTKB_Day3 | 0.795000 | -0.0726 |
| Thaps_hclust_0475 |
 |
 |
0.011 |
0.95 |
0.77 |
lowFe_KTKB_Day5 | 0.656000 | -0.0938 |
| Thaps_hclust_0475 |
 |
 |
0.011 |
0.95 |
0.77 |
BaP | 0.000370 | -0.791 |
| Thaps_hclust_0475 |
 |
 |
0.011 |
0.95 |
0.77 |
exponential_vs_stationary_24highlight | 0.339000 | -0.102 |
| Thaps_hclust_0475 |
 |
 |
0.011 |
0.95 |
0.77 |
co2_elevated_stat_arrays | 0.707000 | -0.1 |
| Thaps_hclust_0475 |
 |
 |
0.011 |
0.95 |
0.77 |
lowtemp_TMEVA | 0.740000 | 0.0926 |
| Thaps_hclust_0475 |
 |
 |
0.011 |
0.95 |
0.77 |
highpH_TMEVA | 0.318000 | -0.162 |
| Thaps_hclust_0475 |
 |
 |
0.011 |
0.95 |
0.77 |
co2_elevated_expo_arrays | 0.326000 | 0.168 |
| Thaps_hclust_0475 |
 |
 |
0.011 |
0.95 |
0.77 |
lowFe_TMEVA | 0.435000 | 0.216 |
| Thaps_hclust_0475 |
 |
 |
0.011 |
0.95 |
0.77 |
exponential_vs_stationary_24light | 0.820000 | -0.0915 |
| Title | Cluster Plot | Dendrogram | e-value | e-value | e-value | Condition | Condition FDR | Condition Difference |
|---|---|---|---|---|---|---|---|---|
| Thaps_hclust_0474 |
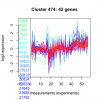 |
 |
0.0078 |
0.000018 |
0.003 |
exponential_vs_stationary_24light | 0.001120 | -0.649 |
| Thaps_hclust_0474 |
 |
 |
0.0078 |
0.000018 |
0.003 |
lowN_TMEVA | 0.828000 | -0.083 |
| Thaps_hclust_0474 |
 |
 |
0.0078 |
0.000018 |
0.003 |
diel_exponential_vs_stationary | 0.277000 | -0.141 |
| Thaps_hclust_0474 |
 |
 |
0.0078 |
0.000018 |
0.003 |
lowSi_TMEVA | 1.000000 | -0.0645 |
| Thaps_hclust_0474 |
 |
 |
0.0078 |
0.000018 |
0.003 |
highlight_arrays | 0.737000 | 0.046 |
| Thaps_hclust_0474 |
 |
 |
0.0078 |
0.000018 |
0.003 |
diel_light_vs_dark | 0.000485 | -0.653 |
| Thaps_hclust_0474 |
 |
 |
0.0078 |
0.000018 |
0.003 |
lowFe_KTKB_Day3 | 0.268000 | 0.188 |
| Thaps_hclust_0474 |
 |
 |
0.0078 |
0.000018 |
0.003 |
lowFe_KTKB_Day5 | 0.001320 | 0.396 |
| Thaps_hclust_0474 |
 |
 |
0.0078 |
0.000018 |
0.003 |
BaP | 0.000370 | -0.9 |
| Thaps_hclust_0474 |
 |
 |
0.0078 |
0.000018 |
0.003 |
exponential_vs_stationary_24highlight | 0.000926 | -0.221 |
