Hierarchical Clusters
Displaying 4001 - 4100 of 7500
| Title | Cluster Plot | Dendrogram | e-value | e-value | e-value | Condition | Condition FDR | Condition Difference |
|---|---|---|---|---|---|---|---|---|
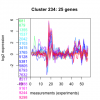
| Thaps_hclust_0234 |
 |
 |
0.036 |
0.063 |
0.24 |
lowtemp_TMEVA | 0.150000 | 0.329 |
| Thaps_hclust_0234 |
 |
 |
0.036 |
0.063 |
0.24 |
highpH_TMEVA | 0.700000 | 0.067 |
| Thaps_hclust_0234 |
 |
 |
0.036 |
0.063 |
0.24 |
co2_elevated_expo_arrays | 0.178000 | 0.189 |
| Thaps_hclust_0234 |
 |
 |
0.036 |
0.063 |
0.24 |
lowFe_TMEVA | 0.304000 | 0.262 |
| Thaps_hclust_0234 |
 |
 |
0.036 |
0.063 |
0.24 |
exponential_vs_stationary_24light | 0.899000 | -0.0516 |
| Title | Cluster Plot | Dendrogram | e-value | e-value | e-value | Condition | Condition FDR | Condition Difference |
|---|---|---|---|---|---|---|---|---|
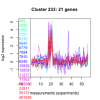
| Thaps_hclust_0233 |
 |
 |
0.01 |
0.026 |
25 |
exponential_vs_stationary_24light | 0.905000 | -0.0443 |
| Thaps_hclust_0233 |
 |
 |
0.01 |
0.026 |
25 |
lowN_TMEVA | 0.761000 | -0.115 |
| Thaps_hclust_0233 |
 |
 |
0.01 |
0.026 |
25 |
diel_exponential_vs_stationary | 0.723000 | 0.0753 |
| Thaps_hclust_0233 |
 |
 |
0.01 |
0.026 |
25 |
lowSi_TMEVA | 0.976000 | 0.12 |
| Thaps_hclust_0233 |
 |
 |
0.01 |
0.026 |
25 |
highlight_arrays | 0.497000 | 0.114 |
| Thaps_hclust_0233 |
 |
 |
0.01 |
0.026 |
25 |
diel_light_vs_dark | 0.959000 | 0.0177 |
| Thaps_hclust_0233 |
 |
 |
0.01 |
0.026 |
25 |
lowFe_KTKB_Day3 | 0.580000 | -0.15 |
| Thaps_hclust_0233 |
 |
 |
0.01 |
0.026 |
25 |
lowFe_KTKB_Day5 | 0.630000 | -0.102 |
| Thaps_hclust_0233 |
 |
 |
0.01 |
0.026 |
25 |
BaP | 0.000370 | 2.27 |
| Thaps_hclust_0233 |
 |
 |
0.01 |
0.026 |
25 |
exponential_vs_stationary_24highlight | 0.967000 | -0.00673 |
| Thaps_hclust_0233 |
 |
 |
0.01 |
0.026 |
25 |
co2_elevated_stat_arrays | 0.152000 | 0.311 |
| Thaps_hclust_0233 |
 |
 |
0.01 |
0.026 |
25 |
lowtemp_TMEVA | 0.673000 | -0.117 |
| Thaps_hclust_0233 |
 |
 |
0.01 |
0.026 |
25 |
highpH_TMEVA | 0.341000 | -0.155 |
| Thaps_hclust_0233 |
 |
 |
0.01 |
0.026 |
25 |
co2_elevated_expo_arrays | 0.464000 | 0.142 |
| Thaps_hclust_0233 |
 |
 |
0.01 |
0.026 |
25 |
lowFe_TMEVA | 0.823000 | -0.0904 |
| Title | Cluster Plot | Dendrogram | e-value | e-value | e-value | Condition | Condition FDR | Condition Difference |
|---|---|---|---|---|---|---|---|---|
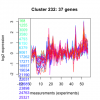
| Thaps_hclust_0232 |
 |
 |
9.2e-16 |
0.000000000000019 |
0.35 |
lowFe_TMEVA | 0.940000 | -0.0331 |
| Thaps_hclust_0232 |
 |
 |
9.2e-16 |
0.000000000000019 |
0.35 |
exponential_vs_stationary_24light | 0.249000 | -0.292 |
| Thaps_hclust_0232 |
 |
 |
9.2e-16 |
0.000000000000019 |
0.35 |
lowN_TMEVA | 0.725000 | -0.128 |
| Thaps_hclust_0232 |
 |
 |
9.2e-16 |
0.000000000000019 |
0.35 |
diel_exponential_vs_stationary | 0.378000 | 0.128 |
| Thaps_hclust_0232 |
 |
 |
9.2e-16 |
0.000000000000019 |
0.35 |
lowSi_TMEVA | 1.000000 | 0.0497 |
| Thaps_hclust_0232 |
 |
 |
9.2e-16 |
0.000000000000019 |
0.35 |
highlight_arrays | 0.000442 | -0.468 |
| Thaps_hclust_0232 |
 |
 |
9.2e-16 |
0.000000000000019 |
0.35 |
diel_light_vs_dark | 0.240000 | -0.186 |
| Thaps_hclust_0232 |
 |
 |
9.2e-16 |
0.000000000000019 |
0.35 |
lowFe_KTKB_Day3 | 0.779000 | 0.0616 |
| Thaps_hclust_0232 |
 |
 |
9.2e-16 |
0.000000000000019 |
0.35 |
lowFe_KTKB_Day5 | 0.849000 | -0.033 |
| Thaps_hclust_0232 |
 |
 |
9.2e-16 |
0.000000000000019 |
0.35 |
BaP | 0.699000 | 0.0692 |
| Thaps_hclust_0232 |
 |
 |
9.2e-16 |
0.000000000000019 |
0.35 |
exponential_vs_stationary_24highlight | 0.587000 | -0.0468 |
| Thaps_hclust_0232 |
 |
 |
9.2e-16 |
0.000000000000019 |
0.35 |
co2_elevated_stat_arrays | 0.002130 | 0.46 |
| Thaps_hclust_0232 |
 |
 |
9.2e-16 |
0.000000000000019 |
0.35 |
lowtemp_TMEVA | 0.575000 | 0.116 |
| Thaps_hclust_0232 |
 |
 |
9.2e-16 |
0.000000000000019 |
0.35 |
highpH_TMEVA | 0.005910 | -0.315 |
| Thaps_hclust_0232 |
 |
 |
9.2e-16 |
0.000000000000019 |
0.35 |
co2_elevated_expo_arrays | 0.926000 | -0.0453 |
| Title | Cluster Plot | Dendrogram | e-value | e-value | e-value | Condition | Condition FDR | Condition Difference |
|---|---|---|---|---|---|---|---|---|
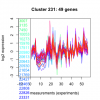
| Thaps_hclust_0231 |
 |
 |
9.5e-23 |
0.000000000000034 |
0.00000039 |
co2_elevated_expo_arrays | 0.487000 | -0.113 |
| Thaps_hclust_0231 |
 |
 |
9.5e-23 |
0.000000000000034 |
0.00000039 |
lowFe_TMEVA | 0.823000 | 0.0825 |
| Thaps_hclust_0231 |
 |
 |
9.5e-23 |
0.000000000000034 |
0.00000039 |
exponential_vs_stationary_24light | 0.576000 | -0.153 |
| Thaps_hclust_0231 |
 |
 |
9.5e-23 |
0.000000000000034 |
0.00000039 |
lowN_TMEVA | 0.607000 | 0.165 |
| Thaps_hclust_0231 |
 |
 |
9.5e-23 |
0.000000000000034 |
0.00000039 |
diel_exponential_vs_stationary | 0.196000 | 0.149 |
| Thaps_hclust_0231 |
 |
 |
9.5e-23 |
0.000000000000034 |
0.00000039 |
lowSi_TMEVA | 1.000000 | -0.0141 |
| Thaps_hclust_0231 |
 |
 |
9.5e-23 |
0.000000000000034 |
0.00000039 |
highlight_arrays | 0.110000 | -0.169 |
| Thaps_hclust_0231 |
 |
 |
9.5e-23 |
0.000000000000034 |
0.00000039 |
diel_light_vs_dark | 0.052700 | -0.244 |
| Thaps_hclust_0231 |
 |
 |
9.5e-23 |
0.000000000000034 |
0.00000039 |
lowFe_KTKB_Day3 | 0.062700 | 0.272 |
| Thaps_hclust_0231 |
 |
 |
9.5e-23 |
0.000000000000034 |
0.00000039 |
lowFe_KTKB_Day5 | 0.345000 | 0.127 |
| Thaps_hclust_0231 |
 |
 |
9.5e-23 |
0.000000000000034 |
0.00000039 |
BaP | 0.342000 | 0.135 |
| Thaps_hclust_0231 |
 |
 |
9.5e-23 |
0.000000000000034 |
0.00000039 |
exponential_vs_stationary_24highlight | 0.476000 | 0.052 |
| Thaps_hclust_0231 |
 |
 |
9.5e-23 |
0.000000000000034 |
0.00000039 |
co2_elevated_stat_arrays | 0.000658 | 0.774 |
| Thaps_hclust_0231 |
 |
 |
9.5e-23 |
0.000000000000034 |
0.00000039 |
lowtemp_TMEVA | 0.000735 | 0.588 |
| Thaps_hclust_0231 |
 |
 |
9.5e-23 |
0.000000000000034 |
0.00000039 |
highpH_TMEVA | 0.027300 | -0.234 |
| Title | Cluster Plot | Dendrogram | e-value | e-value | e-value | Condition | Condition FDR | Condition Difference |
|---|---|---|---|---|---|---|---|---|
| Thaps_hclust_0230 |
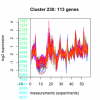 |
|
|
1.1e-30 |
0.0000000000029 |
highpH_TMEVA | 0.000725 | -0.249 |
| Thaps_hclust_0230 |
 |
|
|
1.1e-30 |
0.0000000000029 |
co2_elevated_expo_arrays | 0.934000 | -0.0495 |
| Thaps_hclust_0230 |
 |
|
|
1.1e-30 |
0.0000000000029 |
lowFe_TMEVA | 0.943000 | 0.0434 |
| Thaps_hclust_0230 |
 |
|
|
1.1e-30 |
0.0000000000029 |
exponential_vs_stationary_24light | 0.000581 | -0.701 |
| Thaps_hclust_0230 |
 |
|
|
1.1e-30 |
0.0000000000029 |
lowN_TMEVA | 0.001190 | 0.459 |
| Thaps_hclust_0230 |
 |
|
|
1.1e-30 |
0.0000000000029 |
diel_exponential_vs_stationary | 0.006360 | -0.192 |
| Thaps_hclust_0230 |
 |
|
|
1.1e-30 |
0.0000000000029 |
lowSi_TMEVA | 0.402000 | 0.31 |
| Thaps_hclust_0230 |
 |
|
|
1.1e-30 |
0.0000000000029 |
highlight_arrays | 0.656000 | 0.0409 |
| Thaps_hclust_0230 |
 |
|
|
1.1e-30 |
0.0000000000029 |
diel_light_vs_dark | 0.000485 | -0.306 |
| Thaps_hclust_0230 |
 |
|
|
1.1e-30 |
0.0000000000029 |
lowFe_KTKB_Day3 | 0.200000 | 0.124 |
| Thaps_hclust_0230 |
 |
|
|
1.1e-30 |
0.0000000000029 |
lowFe_KTKB_Day5 | 0.964000 | 0.00449 |
| Thaps_hclust_0230 |
 |
|
|
1.1e-30 |
0.0000000000029 |
BaP | 0.000370 | 0.702 |
| Thaps_hclust_0230 |
 |
|
|
1.1e-30 |
0.0000000000029 |
exponential_vs_stationary_24highlight | 0.000526 | -0.223 |
| Thaps_hclust_0230 |
 |
|
|
1.1e-30 |
0.0000000000029 |
co2_elevated_stat_arrays | 0.000658 | 0.639 |
| Thaps_hclust_0230 |
 |
|
|
1.1e-30 |
0.0000000000029 |
lowtemp_TMEVA | 0.000735 | 0.532 |
| Title | Cluster Plot | Dendrogram | e-value | e-value | e-value | Condition | Condition FDR | Condition Difference |
|---|---|---|---|---|---|---|---|---|
| Thaps_hclust_0229 |
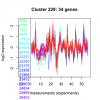 |
 |
9.9e-18 |
0.000000000000034 |
0.0000002 |
lowtemp_TMEVA | 0.000735 | 0.823 |
| Thaps_hclust_0229 |
 |
 |
9.9e-18 |
0.000000000000034 |
0.0000002 |
highpH_TMEVA | 0.358000 | -0.122 |
| Thaps_hclust_0229 |
 |
 |
9.9e-18 |
0.000000000000034 |
0.0000002 |
co2_elevated_expo_arrays | 0.323000 | -0.144 |
| Thaps_hclust_0229 |
 |
 |
9.9e-18 |
0.000000000000034 |
0.0000002 |
lowFe_TMEVA | 0.651000 | -0.133 |
| Thaps_hclust_0229 |
 |
 |
9.9e-18 |
0.000000000000034 |
0.0000002 |
exponential_vs_stationary_24light | 0.900000 | 0.0438 |
| Thaps_hclust_0229 |
 |
 |
9.9e-18 |
0.000000000000034 |
0.0000002 |
lowN_TMEVA | 0.470000 | 0.229 |
| Thaps_hclust_0229 |
 |
 |
9.9e-18 |
0.000000000000034 |
0.0000002 |
diel_exponential_vs_stationary | 0.693000 | 0.0659 |
| Thaps_hclust_0229 |
 |
 |
9.9e-18 |
0.000000000000034 |
0.0000002 |
lowSi_TMEVA | 0.500000 | -0.364 |
| Thaps_hclust_0229 |
 |
 |
9.9e-18 |
0.000000000000034 |
0.0000002 |
highlight_arrays | 0.497000 | -0.0937 |
| Thaps_hclust_0229 |
 |
 |
9.9e-18 |
0.000000000000034 |
0.0000002 |
diel_light_vs_dark | 0.075900 | -0.27 |
| Thaps_hclust_0229 |
 |
 |
9.9e-18 |
0.000000000000034 |
0.0000002 |
lowFe_KTKB_Day3 | 0.046800 | 0.345 |
| Thaps_hclust_0229 |
 |
 |
9.9e-18 |
0.000000000000034 |
0.0000002 |
lowFe_KTKB_Day5 | 0.650000 | 0.0779 |
| Thaps_hclust_0229 |
 |
 |
9.9e-18 |
0.000000000000034 |
0.0000002 |
BaP | 0.029500 | 0.342 |
| Thaps_hclust_0229 |
 |
 |
9.9e-18 |
0.000000000000034 |
0.0000002 |
exponential_vs_stationary_24highlight | 0.024400 | 0.176 |
| Thaps_hclust_0229 |
 |
 |
9.9e-18 |
0.000000000000034 |
0.0000002 |
co2_elevated_stat_arrays | 0.000658 | 0.914 |
| Title | Cluster Plot | Dendrogram | e-value | e-value | e-value | Condition | Condition FDR | Condition Difference |
|---|---|---|---|---|---|---|---|---|
| Thaps_hclust_0228 |
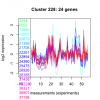 |
 |
0.00000000000028 |
0.0027 |
0.016 |
co2_elevated_stat_arrays | 0.000658 | 0.92 |
| Thaps_hclust_0228 |
 |
 |
0.00000000000028 |
0.0027 |
0.016 |
lowtemp_TMEVA | 0.059000 | 0.437 |
| Thaps_hclust_0228 |
 |
 |
0.00000000000028 |
0.0027 |
0.016 |
highpH_TMEVA | 0.753000 | -0.0574 |
| Thaps_hclust_0228 |
 |
 |
0.00000000000028 |
0.0027 |
0.016 |
co2_elevated_expo_arrays | 0.985000 | 0.011 |
| Thaps_hclust_0228 |
 |
 |
0.00000000000028 |
0.0027 |
0.016 |
lowFe_TMEVA | 0.177000 | -0.343 |
| Thaps_hclust_0228 |
 |
 |
0.00000000000028 |
0.0027 |
0.016 |
exponential_vs_stationary_24light | 0.074400 | -0.513 |
| Thaps_hclust_0228 |
 |
 |
0.00000000000028 |
0.0027 |
0.016 |
lowN_TMEVA | 0.182000 | 0.41 |
| Thaps_hclust_0228 |
 |
 |
0.00000000000028 |
0.0027 |
0.016 |
diel_exponential_vs_stationary | 0.765000 | -0.0633 |
| Thaps_hclust_0228 |
 |
 |
0.00000000000028 |
0.0027 |
0.016 |
lowSi_TMEVA | 0.921000 | -0.174 |
| Thaps_hclust_0228 |
 |
 |
0.00000000000028 |
0.0027 |
0.016 |
highlight_arrays | 0.000442 | 0.465 |
| Thaps_hclust_0228 |
 |
 |
0.00000000000028 |
0.0027 |
0.016 |
diel_light_vs_dark | 0.208000 | -0.242 |
| Thaps_hclust_0228 |
 |
 |
0.00000000000028 |
0.0027 |
0.016 |
lowFe_KTKB_Day3 | 0.975000 | 0.00784 |
| Thaps_hclust_0228 |
 |
 |
0.00000000000028 |
0.0027 |
0.016 |
lowFe_KTKB_Day5 | 0.314000 | -0.191 |
| Thaps_hclust_0228 |
 |
 |
0.00000000000028 |
0.0027 |
0.016 |
BaP | 0.013400 | 0.482 |
| Thaps_hclust_0228 |
 |
 |
0.00000000000028 |
0.0027 |
0.016 |
exponential_vs_stationary_24highlight | 0.231000 | -0.12 |
| Title | Cluster Plot | Dendrogram | e-value | e-value | e-value | Condition | Condition FDR | Condition Difference |
|---|---|---|---|---|---|---|---|---|
| Thaps_hclust_0227 |
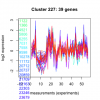 |
 |
1.2e-22 |
0.0000000098 |
0.0018 |
co2_elevated_stat_arrays | 0.004850 | 0.447 |
| Thaps_hclust_0227 |
 |
 |
1.2e-22 |
0.0000000098 |
0.0018 |
lowtemp_TMEVA | 0.000735 | 0.934 |
| Thaps_hclust_0227 |
 |
 |
1.2e-22 |
0.0000000098 |
0.0018 |
highpH_TMEVA | 0.406000 | -0.108 |
| Thaps_hclust_0227 |
 |
 |
1.2e-22 |
0.0000000098 |
0.0018 |
co2_elevated_expo_arrays | 0.985000 | -0.0139 |
| Thaps_hclust_0227 |
 |
 |
1.2e-22 |
0.0000000098 |
0.0018 |
lowFe_TMEVA | 0.975000 | 0.0176 |
