Hierarchical Clusters
Displaying 5301 - 5400 of 7500
| Title | Cluster Plot | Dendrogram | e-value | e-value | e-value | Condition | Condition FDR | Condition Difference |
|---|---|---|---|---|---|---|---|---|
| Thaps_hclust_0147 |
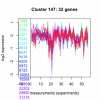 |
 |
0.0000023 |
0.000053 |
1.9 |
lowN_TMEVA | 0.761000 | -0.117 |
| Thaps_hclust_0147 |
 |
 |
0.0000023 |
0.000053 |
1.9 |
diel_exponential_vs_stationary | 0.564000 | -0.0948 |
| Thaps_hclust_0147 |
 |
 |
0.0000023 |
0.000053 |
1.9 |
lowSi_TMEVA | 0.974000 | -0.156 |
| Thaps_hclust_0147 |
 |
 |
0.0000023 |
0.000053 |
1.9 |
highlight_arrays | 0.311000 | -0.138 |
| Thaps_hclust_0147 |
 |
 |
0.0000023 |
0.000053 |
1.9 |
diel_light_vs_dark | 0.934000 | 0.0251 |
| Thaps_hclust_0147 |
 |
 |
0.0000023 |
0.000053 |
1.9 |
lowFe_KTKB_Day3 | 0.407000 | -0.17 |
| Thaps_hclust_0147 |
 |
 |
0.0000023 |
0.000053 |
1.9 |
lowFe_KTKB_Day5 | 0.347000 | 0.152 |
| Thaps_hclust_0147 |
 |
 |
0.0000023 |
0.000053 |
1.9 |
BaP | 0.000370 | -0.659 |
| Thaps_hclust_0147 |
 |
 |
0.0000023 |
0.000053 |
1.9 |
exponential_vs_stationary_24highlight | 0.344000 | 0.0822 |
| Thaps_hclust_0147 |
 |
 |
0.0000023 |
0.000053 |
1.9 |
co2_elevated_stat_arrays | 0.000658 | -0.653 |
| Title | Cluster Plot | Dendrogram | e-value | e-value | e-value | Condition | Condition FDR | Condition Difference |
|---|---|---|---|---|---|---|---|---|
| Thaps_hclust_0146 |
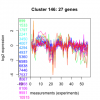 |
 |
0.00000000081 |
0.000016 |
0.0025 |
co2_elevated_stat_arrays | 0.748000 | 0.0839 |
| Thaps_hclust_0146 |
 |
 |
0.00000000081 |
0.000016 |
0.0025 |
lowtemp_TMEVA | 0.020400 | -0.495 |
| Thaps_hclust_0146 |
 |
 |
0.00000000081 |
0.000016 |
0.0025 |
highpH_TMEVA | 0.301000 | 0.15 |
| Thaps_hclust_0146 |
 |
 |
0.00000000081 |
0.000016 |
0.0025 |
co2_elevated_expo_arrays | 0.898000 | 0.0548 |
| Thaps_hclust_0146 |
 |
 |
0.00000000081 |
0.000016 |
0.0025 |
lowFe_TMEVA | 0.432000 | -0.201 |
| Thaps_hclust_0146 |
 |
 |
0.00000000081 |
0.000016 |
0.0025 |
exponential_vs_stationary_24light | 0.222000 | -0.343 |
| Thaps_hclust_0146 |
 |
 |
0.00000000081 |
0.000016 |
0.0025 |
lowN_TMEVA | 0.130000 | 0.424 |
| Thaps_hclust_0146 |
 |
 |
0.00000000081 |
0.000016 |
0.0025 |
diel_exponential_vs_stationary | 0.000602 | -0.632 |
| Thaps_hclust_0146 |
 |
 |
0.00000000081 |
0.000016 |
0.0025 |
lowSi_TMEVA | 0.321000 | -0.445 |
| Thaps_hclust_0146 |
 |
 |
0.00000000081 |
0.000016 |
0.0025 |
highlight_arrays | 0.184000 | 0.186 |
| Thaps_hclust_0146 |
 |
 |
0.00000000081 |
0.000016 |
0.0025 |
diel_light_vs_dark | 0.000485 | 0.573 |
| Thaps_hclust_0146 |
 |
 |
0.00000000081 |
0.000016 |
0.0025 |
lowFe_KTKB_Day3 | 0.390000 | -0.187 |
| Thaps_hclust_0146 |
 |
 |
0.00000000081 |
0.000016 |
0.0025 |
lowFe_KTKB_Day5 | 0.684000 | 0.08 |
| Thaps_hclust_0146 |
 |
 |
0.00000000081 |
0.000016 |
0.0025 |
BaP | 0.010500 | -0.455 |
| Thaps_hclust_0146 |
 |
 |
0.00000000081 |
0.000016 |
0.0025 |
exponential_vs_stationary_24highlight | 0.180000 | -0.124 |
| Title | Cluster Plot | Dendrogram | e-value | e-value | e-value | Condition | Condition FDR | Condition Difference |
|---|---|---|---|---|---|---|---|---|
| Thaps_hclust_0145 |
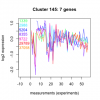 |
 |
0.015 |
1.6 |
11 |
exponential_vs_stationary_24highlight | 0.660000 | -0.0833 |
| Thaps_hclust_0145 |
 |
 |
0.015 |
1.6 |
11 |
co2_elevated_stat_arrays | 0.892000 | 0.053 |
| Thaps_hclust_0145 |
 |
 |
0.015 |
1.6 |
11 |
lowtemp_TMEVA | 0.017100 | -1.22 |
| Thaps_hclust_0145 |
 |
 |
0.015 |
1.6 |
11 |
highpH_TMEVA | 0.435000 | 0.201 |
| Thaps_hclust_0145 |
 |
 |
0.015 |
1.6 |
11 |
co2_elevated_expo_arrays | 0.985000 | 0.019 |
| Thaps_hclust_0145 |
 |
 |
0.015 |
1.6 |
11 |
lowFe_TMEVA | 0.181000 | -0.592 |
| Thaps_hclust_0145 |
 |
 |
0.015 |
1.6 |
11 |
exponential_vs_stationary_24light | 0.957000 | -0.0334 |
| Thaps_hclust_0145 |
 |
 |
0.015 |
1.6 |
11 |
lowN_TMEVA | 0.684000 | 0.201 |
| Thaps_hclust_0145 |
 |
 |
0.015 |
1.6 |
11 |
diel_exponential_vs_stationary | 0.860000 | -0.0623 |
| Thaps_hclust_0145 |
 |
 |
0.015 |
1.6 |
11 |
lowSi_TMEVA | 0.086800 | -1.09 |
| Thaps_hclust_0145 |
 |
 |
0.015 |
1.6 |
11 |
highlight_arrays | 0.381000 | 0.236 |
| Thaps_hclust_0145 |
 |
 |
0.015 |
1.6 |
11 |
diel_light_vs_dark | 0.293000 | 0.381 |
| Thaps_hclust_0145 |
 |
 |
0.015 |
1.6 |
11 |
lowFe_KTKB_Day3 | 0.057400 | -0.789 |
| Thaps_hclust_0145 |
 |
 |
0.015 |
1.6 |
11 |
lowFe_KTKB_Day5 | 0.150000 | -0.5 |
| Thaps_hclust_0145 |
 |
 |
0.015 |
1.6 |
11 |
BaP | 0.498000 | -0.261 |
| Title | Cluster Plot | Dendrogram | e-value | e-value | e-value | Condition | Condition FDR | Condition Difference |
|---|---|---|---|---|---|---|---|---|
| Thaps_hclust_0144 |
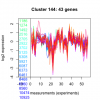 |
 |
0.000000001 |
0.0000000019 |
0.00000019 |
BaP | 0.000709 | -0.508 |
| Thaps_hclust_0144 |
 |
 |
0.000000001 |
0.0000000019 |
0.00000019 |
exponential_vs_stationary_24highlight | 0.065900 | -0.129 |
| Thaps_hclust_0144 |
 |
 |
0.000000001 |
0.0000000019 |
0.00000019 |
co2_elevated_stat_arrays | 0.014400 | -0.367 |
| Thaps_hclust_0144 |
 |
 |
0.000000001 |
0.0000000019 |
0.00000019 |
lowtemp_TMEVA | 0.000735 | -0.591 |
| Thaps_hclust_0144 |
 |
 |
0.000000001 |
0.0000000019 |
0.00000019 |
highpH_TMEVA | 0.010500 | 0.277 |
| Thaps_hclust_0144 |
 |
 |
0.000000001 |
0.0000000019 |
0.00000019 |
co2_elevated_expo_arrays | 0.985000 | -0.0139 |
| Thaps_hclust_0144 |
 |
 |
0.000000001 |
0.0000000019 |
0.00000019 |
lowFe_TMEVA | 0.215000 | -0.263 |
| Thaps_hclust_0144 |
 |
 |
0.000000001 |
0.0000000019 |
0.00000019 |
exponential_vs_stationary_24light | 0.021700 | -0.498 |
| Thaps_hclust_0144 |
 |
 |
0.000000001 |
0.0000000019 |
0.00000019 |
lowN_TMEVA | 0.035200 | 0.46 |
| Thaps_hclust_0144 |
 |
 |
0.000000001 |
0.0000000019 |
0.00000019 |
diel_exponential_vs_stationary | 0.000602 | -0.804 |
| Thaps_hclust_0144 |
 |
 |
0.000000001 |
0.0000000019 |
0.00000019 |
lowSi_TMEVA | 0.321000 | -0.396 |
| Thaps_hclust_0144 |
 |
 |
0.000000001 |
0.0000000019 |
0.00000019 |
highlight_arrays | 0.000442 | 0.409 |
| Thaps_hclust_0144 |
 |
 |
0.000000001 |
0.0000000019 |
0.00000019 |
diel_light_vs_dark | 0.013600 | 0.319 |
| Thaps_hclust_0144 |
 |
 |
0.000000001 |
0.0000000019 |
0.00000019 |
lowFe_KTKB_Day3 | 0.002990 | -0.428 |
| Thaps_hclust_0144 |
 |
 |
0.000000001 |
0.0000000019 |
0.00000019 |
lowFe_KTKB_Day5 | 0.062800 | -0.248 |
| Title | Cluster Plot | Dendrogram | e-value | e-value | e-value | Condition | Condition FDR | Condition Difference |
|---|---|---|---|---|---|---|---|---|
| Thaps_hclust_0143 |
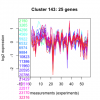 |
 |
0.018 |
0.041 |
0.67 |
lowFe_KTKB_Day5 | 0.496000 | -0.132 |
| Thaps_hclust_0143 |
 |
 |
0.018 |
0.041 |
0.67 |
BaP | 0.930000 | -0.0211 |
| Thaps_hclust_0143 |
 |
 |
0.018 |
0.041 |
0.67 |
exponential_vs_stationary_24highlight | 0.452000 | -0.076 |
| Thaps_hclust_0143 |
 |
 |
0.018 |
0.041 |
0.67 |
co2_elevated_stat_arrays | 0.146000 | -0.307 |
| Thaps_hclust_0143 |
 |
 |
0.018 |
0.041 |
0.67 |
lowtemp_TMEVA | 0.195000 | -0.295 |
| Thaps_hclust_0143 |
 |
 |
0.018 |
0.041 |
0.67 |
highpH_TMEVA | 0.115000 | 0.225 |
| Thaps_hclust_0143 |
 |
 |
0.018 |
0.041 |
0.67 |
co2_elevated_expo_arrays | 0.944000 | -0.0322 |
| Thaps_hclust_0143 |
 |
 |
0.018 |
0.041 |
0.67 |
lowFe_TMEVA | 0.761000 | 0.11 |
| Thaps_hclust_0143 |
 |
 |
0.018 |
0.041 |
0.67 |
exponential_vs_stationary_24light | 0.368000 | -0.273 |
| Thaps_hclust_0143 |
 |
 |
0.018 |
0.041 |
0.67 |
lowN_TMEVA | 0.963000 | 0.0183 |
| Thaps_hclust_0143 |
 |
 |
0.018 |
0.041 |
0.67 |
diel_exponential_vs_stationary | 0.031700 | -0.32 |
| Thaps_hclust_0143 |
 |
 |
0.018 |
0.041 |
0.67 |
lowSi_TMEVA | 1.000000 | 0.0902 |
| Thaps_hclust_0143 |
 |
 |
0.018 |
0.041 |
0.67 |
highlight_arrays | 0.014800 | 0.337 |
| Thaps_hclust_0143 |
 |
 |
0.018 |
0.041 |
0.67 |
diel_light_vs_dark | 0.030500 | 0.374 |
| Thaps_hclust_0143 |
 |
 |
0.018 |
0.041 |
0.67 |
lowFe_KTKB_Day3 | 0.447000 | -0.18 |
| Title | Cluster Plot | Dendrogram | e-value | e-value | e-value | Condition | Condition FDR | Condition Difference |
|---|---|---|---|---|---|---|---|---|
| Thaps_hclust_0142 |
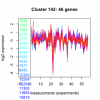 |
 |
0.000000000000013 |
0.0000000004 |
0.001 |
lowFe_KTKB_Day3 | 0.003620 | -0.424 |
| Thaps_hclust_0142 |
 |
 |
0.000000000000013 |
0.0000000004 |
0.001 |
lowFe_KTKB_Day5 | 0.239000 | -0.16 |
| Thaps_hclust_0142 |
 |
 |
0.000000000000013 |
0.0000000004 |
0.001 |
BaP | 0.019700 | 0.312 |
| Thaps_hclust_0142 |
 |
 |
0.000000000000013 |
0.0000000004 |
0.001 |
exponential_vs_stationary_24highlight | 0.347000 | -0.0684 |
| Thaps_hclust_0142 |
 |
 |
0.000000000000013 |
0.0000000004 |
0.001 |
co2_elevated_stat_arrays | 0.000658 | -0.58 |
| Thaps_hclust_0142 |
 |
 |
0.000000000000013 |
0.0000000004 |
0.001 |
lowtemp_TMEVA | 0.317000 | -0.175 |
| Thaps_hclust_0142 |
 |
 |
0.000000000000013 |
0.0000000004 |
0.001 |
highpH_TMEVA | 0.005560 | 0.291 |
| Thaps_hclust_0142 |
 |
 |
0.000000000000013 |
0.0000000004 |
0.001 |
co2_elevated_expo_arrays | 0.985000 | 0.0136 |
| Thaps_hclust_0142 |
 |
 |
0.000000000000013 |
0.0000000004 |
0.001 |
lowFe_TMEVA | 0.795000 | -0.093 |
| Thaps_hclust_0142 |
 |
 |
0.000000000000013 |
0.0000000004 |
0.001 |
exponential_vs_stationary_24light | 0.159000 | -0.32 |
| Thaps_hclust_0142 |
 |
 |
0.000000000000013 |
0.0000000004 |
0.001 |
lowN_TMEVA | 0.067200 | 0.42 |
| Thaps_hclust_0142 |
 |
 |
0.000000000000013 |
0.0000000004 |
0.001 |
diel_exponential_vs_stationary | 0.000602 | -0.726 |
| Thaps_hclust_0142 |
 |
 |
0.000000000000013 |
0.0000000004 |
0.001 |
lowSi_TMEVA | 0.954000 | -0.167 |
| Thaps_hclust_0142 |
 |
 |
0.000000000000013 |
0.0000000004 |
0.001 |
highlight_arrays | 0.002540 | 0.293 |
| Thaps_hclust_0142 |
 |
 |
0.000000000000013 |
0.0000000004 |
0.001 |
diel_light_vs_dark | 0.000485 | 0.46 |
| Title | Cluster Plot | Dendrogram | e-value | e-value | e-value | Condition | Condition FDR | Condition Difference |
|---|---|---|---|---|---|---|---|---|
| Thaps_hclust_0141 |
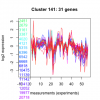 |
 |
0.000021 |
0.0007 |
0.0051 |
lowFe_KTKB_Day3 | 0.000862 | -0.705 |
| Thaps_hclust_0141 |
 |
 |
0.000021 |
0.0007 |
0.0051 |
lowFe_KTKB_Day5 | 0.068800 | -0.291 |
| Thaps_hclust_0141 |
 |
 |
0.000021 |
0.0007 |
0.0051 |
BaP | 0.371000 | 0.161 |
| Thaps_hclust_0141 |
 |
 |
0.000021 |
0.0007 |
0.0051 |
exponential_vs_stationary_24highlight | 0.916000 | -0.0124 |
| Thaps_hclust_0141 |
 |
 |
0.000021 |
0.0007 |
0.0051 |
co2_elevated_stat_arrays | 0.001190 | -0.549 |
| Thaps_hclust_0141 |
 |
 |
0.000021 |
0.0007 |
0.0051 |
lowtemp_TMEVA | 0.000735 | -0.791 |
| Thaps_hclust_0141 |
 |
 |
0.000021 |
0.0007 |
0.0051 |
highpH_TMEVA | 0.005910 | 0.345 |
| Thaps_hclust_0141 |
 |
 |
0.000021 |
0.0007 |
0.0051 |
co2_elevated_expo_arrays | 0.976000 | -0.0209 |
| Thaps_hclust_0141 |
 |
 |
0.000021 |
0.0007 |
0.0051 |
lowFe_TMEVA | 0.004550 | -0.549 |
| Thaps_hclust_0141 |
 |
 |
0.000021 |
0.0007 |
0.0051 |
exponential_vs_stationary_24light | 0.051800 | -0.497 |
| Thaps_hclust_0141 |
 |
 |
0.000021 |
0.0007 |
0.0051 |
lowN_TMEVA | 0.349000 | 0.283 |
| Thaps_hclust_0141 |
 |
 |
0.000021 |
0.0007 |
0.0051 |
diel_exponential_vs_stationary | 0.000602 | -0.818 |
| Thaps_hclust_0141 |
 |
 |
0.000021 |
0.0007 |
0.0051 |
lowSi_TMEVA | 0.914000 | -0.18 |
| Thaps_hclust_0141 |
 |
 |
0.000021 |
0.0007 |
0.0051 |
highlight_arrays | 0.001570 | 0.396 |
| Thaps_hclust_0141 |
 |
 |
0.000021 |
0.0007 |
0.0051 |
diel_light_vs_dark | 0.306000 | 0.179 |
