Hierarchical Clusters
Displaying 5601 - 5700 of 7500
| Title | Cluster Plot | Dendrogram | e-value | e-value | e-value | Condition | Condition FDR | Condition Difference |
|---|---|---|---|---|---|---|---|---|
| Thaps_hclust_0127 |
 |
 |
2.6 |
32 |
48 |
lowFe_KTKB_Day5 | 0.953000 | 0.0175 |
| Thaps_hclust_0127 |
 |
 |
2.6 |
32 |
48 |
BaP | 0.579000 | 0.146 |
| Thaps_hclust_0127 |
 |
 |
2.6 |
32 |
48 |
exponential_vs_stationary_24highlight | 0.779000 | -0.038 |
| Thaps_hclust_0127 |
 |
 |
2.6 |
32 |
48 |
co2_elevated_stat_arrays | 0.437000 | -0.2 |
| Thaps_hclust_0127 |
 |
 |
2.6 |
32 |
48 |
lowtemp_TMEVA | 0.020400 | -0.657 |
| Thaps_hclust_0127 |
 |
 |
2.6 |
32 |
48 |
highpH_TMEVA | 0.749000 | -0.0658 |
| Thaps_hclust_0127 |
 |
 |
2.6 |
32 |
48 |
co2_elevated_expo_arrays | 0.873000 | -0.063 |
| Thaps_hclust_0127 |
 |
 |
2.6 |
32 |
48 |
lowFe_TMEVA | 0.888000 | 0.0583 |
| Thaps_hclust_0127 |
 |
 |
2.6 |
32 |
48 |
exponential_vs_stationary_24light | 0.945000 | -0.0306 |
| Thaps_hclust_0127 |
 |
 |
2.6 |
32 |
48 |
lowN_TMEVA | 0.841000 | -0.0833 |
| Title | Cluster Plot | Dendrogram | e-value | e-value | e-value | Condition | Condition FDR | Condition Difference |
|---|---|---|---|---|---|---|---|---|
| Thaps_hclust_0126 |
 |
 |
0.025 |
1.3 |
0.6 |
lowN_TMEVA | 0.866000 | 0.0539 |
| Thaps_hclust_0126 |
 |
 |
0.025 |
1.3 |
0.6 |
diel_exponential_vs_stationary | 0.000602 | -0.608 |
| Thaps_hclust_0126 |
 |
 |
0.025 |
1.3 |
0.6 |
lowSi_TMEVA | 0.704000 | -0.287 |
| Thaps_hclust_0126 |
 |
 |
0.025 |
1.3 |
0.6 |
highlight_arrays | 0.945000 | 0.0123 |
| Thaps_hclust_0126 |
 |
 |
0.025 |
1.3 |
0.6 |
diel_light_vs_dark | 0.000485 | 0.732 |
| Thaps_hclust_0126 |
 |
 |
0.025 |
1.3 |
0.6 |
lowFe_KTKB_Day3 | 0.406000 | -0.201 |
| Thaps_hclust_0126 |
 |
 |
0.025 |
1.3 |
0.6 |
lowFe_KTKB_Day5 | 0.106000 | -0.307 |
| Thaps_hclust_0126 |
 |
 |
0.025 |
1.3 |
0.6 |
BaP | 0.003850 | 0.556 |
| Thaps_hclust_0126 |
 |
 |
0.025 |
1.3 |
0.6 |
exponential_vs_stationary_24highlight | 0.023100 | -0.226 |
| Thaps_hclust_0126 |
 |
 |
0.025 |
1.3 |
0.6 |
co2_elevated_stat_arrays | 0.311000 | -0.229 |
| Thaps_hclust_0126 |
 |
 |
0.025 |
1.3 |
0.6 |
lowtemp_TMEVA | 0.169000 | -0.331 |
| Thaps_hclust_0126 |
 |
 |
0.025 |
1.3 |
0.6 |
highpH_TMEVA | 0.022700 | -0.337 |
| Thaps_hclust_0126 |
 |
 |
0.025 |
1.3 |
0.6 |
co2_elevated_expo_arrays | 0.474000 | -0.138 |
| Thaps_hclust_0126 |
 |
 |
0.025 |
1.3 |
0.6 |
lowFe_TMEVA | 0.085600 | -0.418 |
| Thaps_hclust_0126 |
 |
 |
0.025 |
1.3 |
0.6 |
exponential_vs_stationary_24light | 0.187000 | -0.397 |
| Title | Cluster Plot | Dendrogram | e-value | e-value | e-value | Condition | Condition FDR | Condition Difference |
|---|---|---|---|---|---|---|---|---|
| Thaps_hclust_0125 |
 |
 |
0.1 |
0.35 |
2.4 |
exponential_vs_stationary_24light | 0.521000 | -0.248 |
| Thaps_hclust_0125 |
 |
 |
0.1 |
0.35 |
2.4 |
lowN_TMEVA | 0.019200 | 0.809 |
| Thaps_hclust_0125 |
 |
 |
0.1 |
0.35 |
2.4 |
diel_exponential_vs_stationary | 0.351000 | -0.198 |
| Thaps_hclust_0125 |
 |
 |
0.1 |
0.35 |
2.4 |
lowSi_TMEVA | 0.976000 | -0.122 |
| Thaps_hclust_0125 |
 |
 |
0.1 |
0.35 |
2.4 |
highlight_arrays | 0.644000 | -0.0885 |
| Thaps_hclust_0125 |
 |
 |
0.1 |
0.35 |
2.4 |
diel_light_vs_dark | 0.629000 | -0.136 |
| Thaps_hclust_0125 |
 |
 |
0.1 |
0.35 |
2.4 |
lowFe_KTKB_Day3 | 0.725000 | -0.111 |
| Thaps_hclust_0125 |
 |
 |
0.1 |
0.35 |
2.4 |
lowFe_KTKB_Day5 | 0.059800 | -0.427 |
| Thaps_hclust_0125 |
 |
 |
0.1 |
0.35 |
2.4 |
BaP | 0.280000 | -0.271 |
| Thaps_hclust_0125 |
 |
 |
0.1 |
0.35 |
2.4 |
exponential_vs_stationary_24highlight | 0.451000 | -0.0943 |
| Thaps_hclust_0125 |
 |
 |
0.1 |
0.35 |
2.4 |
co2_elevated_stat_arrays | 0.949000 | -0.0183 |
| Thaps_hclust_0125 |
 |
 |
0.1 |
0.35 |
2.4 |
lowtemp_TMEVA | 0.442000 | 0.222 |
| Thaps_hclust_0125 |
 |
 |
0.1 |
0.35 |
2.4 |
highpH_TMEVA | 0.811000 | 0.053 |
| Thaps_hclust_0125 |
 |
 |
0.1 |
0.35 |
2.4 |
co2_elevated_expo_arrays | 0.021800 | 0.329 |
| Thaps_hclust_0125 |
 |
 |
0.1 |
0.35 |
2.4 |
lowFe_TMEVA | 0.742000 | 0.126 |
| Title | Cluster Plot | Dendrogram | e-value | e-value | e-value | Condition | Condition FDR | Condition Difference |
|---|---|---|---|---|---|---|---|---|
| Thaps_hclust_0124 |
 |
 |
1 |
0.23 |
42 |
lowFe_TMEVA | 0.709000 | 0.141 |
| Thaps_hclust_0124 |
 |
 |
1 |
0.23 |
42 |
exponential_vs_stationary_24light | 0.664000 | -0.182 |
| Thaps_hclust_0124 |
 |
 |
1 |
0.23 |
42 |
lowN_TMEVA | 0.666000 | 0.177 |
| Thaps_hclust_0124 |
 |
 |
1 |
0.23 |
42 |
diel_exponential_vs_stationary | 0.028700 | -0.434 |
| Thaps_hclust_0124 |
 |
 |
1 |
0.23 |
42 |
lowSi_TMEVA | 0.670000 | 0.318 |
| Thaps_hclust_0124 |
 |
 |
1 |
0.23 |
42 |
highlight_arrays | 0.331000 | 0.181 |
| Thaps_hclust_0124 |
 |
 |
1 |
0.23 |
42 |
diel_light_vs_dark | 0.557000 | -0.165 |
| Thaps_hclust_0124 |
 |
 |
1 |
0.23 |
42 |
lowFe_KTKB_Day3 | 0.002990 | -0.803 |
| Thaps_hclust_0124 |
 |
 |
1 |
0.23 |
42 |
lowFe_KTKB_Day5 | 0.284000 | -0.254 |
| Thaps_hclust_0124 |
 |
 |
1 |
0.23 |
42 |
BaP | 0.586000 | -0.148 |
| Thaps_hclust_0124 |
 |
 |
1 |
0.23 |
42 |
exponential_vs_stationary_24highlight | 0.988000 | -0.00225 |
| Thaps_hclust_0124 |
 |
 |
1 |
0.23 |
42 |
co2_elevated_stat_arrays | 0.189000 | -0.324 |
| Thaps_hclust_0124 |
 |
 |
1 |
0.23 |
42 |
lowtemp_TMEVA | 0.964000 | -0.0169 |
| Thaps_hclust_0124 |
 |
 |
1 |
0.23 |
42 |
highpH_TMEVA | 0.372000 | 0.166 |
| Thaps_hclust_0124 |
 |
 |
1 |
0.23 |
42 |
co2_elevated_expo_arrays | 0.513000 | 0.145 |
| Title | Cluster Plot | Dendrogram | e-value | e-value | e-value | Condition | Condition FDR | Condition Difference |
|---|---|---|---|---|---|---|---|---|
| Thaps_hclust_0123 |
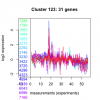 |
 |
0.000073 |
0.05 |
0.076 |
co2_elevated_expo_arrays | 0.896000 | 0.0551 |
| Thaps_hclust_0123 |
 |
 |
0.000073 |
0.05 |
0.076 |
lowFe_TMEVA | 0.996000 | 0.00289 |
| Thaps_hclust_0123 |
 |
 |
0.000073 |
0.05 |
0.076 |
exponential_vs_stationary_24light | 0.806000 | -0.0885 |
| Thaps_hclust_0123 |
 |
 |
0.000073 |
0.05 |
0.076 |
lowN_TMEVA | 0.894000 | -0.0399 |
| Thaps_hclust_0123 |
 |
 |
0.000073 |
0.05 |
0.076 |
diel_exponential_vs_stationary | 0.141000 | -0.209 |
| Thaps_hclust_0123 |
 |
 |
0.000073 |
0.05 |
0.076 |
lowSi_TMEVA | 1.000000 | -0.0551 |
| Thaps_hclust_0123 |
 |
 |
0.000073 |
0.05 |
0.076 |
highlight_arrays | 0.085100 | 0.221 |
| Thaps_hclust_0123 |
 |
 |
0.000073 |
0.05 |
0.076 |
diel_light_vs_dark | 0.097300 | -0.267 |
| Thaps_hclust_0123 |
 |
 |
0.000073 |
0.05 |
0.076 |
lowFe_KTKB_Day3 | 0.334000 | -0.191 |
| Thaps_hclust_0123 |
 |
 |
0.000073 |
0.05 |
0.076 |
lowFe_KTKB_Day5 | 0.325000 | 0.164 |
| Thaps_hclust_0123 |
 |
 |
0.000073 |
0.05 |
0.076 |
BaP | 0.009470 | 0.408 |
| Thaps_hclust_0123 |
 |
 |
0.000073 |
0.05 |
0.076 |
exponential_vs_stationary_24highlight | 0.176000 | -0.117 |
| Thaps_hclust_0123 |
 |
 |
0.000073 |
0.05 |
0.076 |
co2_elevated_stat_arrays | 0.774000 | -0.0782 |
| Thaps_hclust_0123 |
 |
 |
0.000073 |
0.05 |
0.076 |
lowtemp_TMEVA | 0.363000 | 0.192 |
| Thaps_hclust_0123 |
 |
 |
0.000073 |
0.05 |
0.076 |
highpH_TMEVA | 0.017100 | 0.293 |
| Title | Cluster Plot | Dendrogram | e-value | e-value | e-value | Condition | Condition FDR | Condition Difference |
|---|---|---|---|---|---|---|---|---|
| Thaps_hclust_0122 |
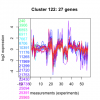 |
 |
0.0000037 |
0.061 |
0.0018 |
highpH_TMEVA | 0.000725 | 0.544 |
| Thaps_hclust_0122 |
 |
 |
0.0000037 |
0.061 |
0.0018 |
co2_elevated_expo_arrays | 0.145000 | 0.195 |
| Thaps_hclust_0122 |
 |
 |
0.0000037 |
0.061 |
0.0018 |
lowFe_TMEVA | 0.212000 | -0.305 |
| Thaps_hclust_0122 |
 |
 |
0.0000037 |
0.061 |
0.0018 |
exponential_vs_stationary_24light | 0.000581 | -1.09 |
| Thaps_hclust_0122 |
 |
 |
0.0000037 |
0.061 |
0.0018 |
lowN_TMEVA | 0.001190 | 0.947 |
| Thaps_hclust_0122 |
 |
 |
0.0000037 |
0.061 |
0.0018 |
diel_exponential_vs_stationary | 0.000602 | -1.5 |
| Thaps_hclust_0122 |
 |
 |
0.0000037 |
0.061 |
0.0018 |
lowSi_TMEVA | 0.590000 | -0.33 |
| Thaps_hclust_0122 |
 |
 |
0.0000037 |
0.061 |
0.0018 |
highlight_arrays | 0.000442 | 0.655 |
| Thaps_hclust_0122 |
 |
 |
0.0000037 |
0.061 |
0.0018 |
diel_light_vs_dark | 0.053000 | 0.324 |
| Thaps_hclust_0122 |
 |
 |
0.0000037 |
0.061 |
0.0018 |
lowFe_KTKB_Day3 | 0.000862 | -0.559 |
| Thaps_hclust_0122 |
 |
 |
0.0000037 |
0.061 |
0.0018 |
lowFe_KTKB_Day5 | 0.557000 | -0.112 |
| Thaps_hclust_0122 |
 |
 |
0.0000037 |
0.061 |
0.0018 |
BaP | 0.000370 | 0.798 |
| Thaps_hclust_0122 |
 |
 |
0.0000037 |
0.061 |
0.0018 |
exponential_vs_stationary_24highlight | 0.087000 | -0.152 |
| Thaps_hclust_0122 |
 |
 |
0.0000037 |
0.061 |
0.0018 |
co2_elevated_stat_arrays | 0.178000 | -0.273 |
| Thaps_hclust_0122 |
 |
 |
0.0000037 |
0.061 |
0.0018 |
lowtemp_TMEVA | 0.109000 | -0.344 |
| Title | Cluster Plot | Dendrogram | e-value | e-value | e-value | Condition | Condition FDR | Condition Difference |
|---|---|---|---|---|---|---|---|---|
| Thaps_hclust_0121 |
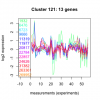 |
 |
0.00021 |
0.77 |
30 |
lowtemp_TMEVA | 0.848000 | -0.0696 |
| Thaps_hclust_0121 |
 |
 |
0.00021 |
0.77 |
30 |
highpH_TMEVA | 0.015700 | 0.482 |
| Thaps_hclust_0121 |
 |
 |
0.00021 |
0.77 |
30 |
co2_elevated_expo_arrays | 0.971000 | -0.0227 |
| Thaps_hclust_0121 |
 |
 |
0.00021 |
0.77 |
30 |
lowFe_TMEVA | 0.251000 | 0.367 |
| Thaps_hclust_0121 |
 |
 |
0.00021 |
0.77 |
30 |
exponential_vs_stationary_24light | 0.020600 | -0.877 |
| Thaps_hclust_0121 |
 |
 |
0.00021 |
0.77 |
30 |
lowN_TMEVA | 0.509000 | 0.264 |
| Thaps_hclust_0121 |
 |
 |
0.00021 |
0.77 |
30 |
diel_exponential_vs_stationary | 0.003430 | -0.642 |
| Thaps_hclust_0121 |
 |
 |
0.00021 |
0.77 |
30 |
lowSi_TMEVA | 0.016100 | 1.08 |
| Thaps_hclust_0121 |
 |
 |
0.00021 |
0.77 |
30 |
highlight_arrays | 0.009800 | 0.498 |
| Thaps_hclust_0121 |
 |
 |
0.00021 |
0.77 |
30 |
diel_light_vs_dark | 0.367000 | -0.246 |
| Thaps_hclust_0121 |
 |
 |
0.00021 |
0.77 |
30 |
lowFe_KTKB_Day3 | 0.595000 | -0.175 |
| Thaps_hclust_0121 |
 |
 |
0.00021 |
0.77 |
30 |
lowFe_KTKB_Day5 | 0.827000 | -0.0609 |
| Thaps_hclust_0121 |
 |
 |
0.00021 |
0.77 |
30 |
BaP | 0.388000 | 0.24 |
| Thaps_hclust_0121 |
 |
 |
0.00021 |
0.77 |
30 |
exponential_vs_stationary_24highlight | 0.025600 | -0.292 |
| Thaps_hclust_0121 |
 |
 |
0.00021 |
0.77 |
30 |
co2_elevated_stat_arrays | 0.696000 | -0.115 |
