Hierarchical Clusters
Displaying 701 - 800 of 7500
| Title | Cluster Plot | Dendrogram | e-value | e-value | e-value | Condition | Condition FDR | Condition Difference |
|---|---|---|---|---|---|---|---|---|
| Thaps_hclust_0454 |
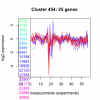 |
 |
0.0000012 |
0.00054 |
0.21 |
co2_elevated_stat_arrays | 0.534000 | -0.15 |
| Thaps_hclust_0454 |
 |
 |
0.0000012 |
0.00054 |
0.21 |
lowtemp_TMEVA | 0.578000 | 0.137 |
| Thaps_hclust_0454 |
 |
 |
0.0000012 |
0.00054 |
0.21 |
highpH_TMEVA | 0.302000 | -0.153 |
| Thaps_hclust_0454 |
 |
 |
0.0000012 |
0.00054 |
0.21 |
co2_elevated_expo_arrays | 0.888000 | 0.0582 |
| Thaps_hclust_0454 |
 |
 |
0.0000012 |
0.00054 |
0.21 |
lowFe_TMEVA | 0.473000 | -0.19 |
| Title | Cluster Plot | Dendrogram | e-value | e-value | e-value | Condition | Condition FDR | Condition Difference |
|---|---|---|---|---|---|---|---|---|
| Thaps_hclust_0453 |
 |
 |
0.000000000093 |
0.000000041 |
0.00016 |
exponential_vs_stationary_24light | 0.269000 | -0.26 |
| Thaps_hclust_0453 |
 |
 |
0.000000000093 |
0.000000041 |
0.00016 |
lowN_TMEVA | 0.963000 | -0.0182 |
| Thaps_hclust_0453 |
 |
 |
0.000000000093 |
0.000000041 |
0.00016 |
diel_exponential_vs_stationary | 0.564000 | 0.0786 |
| Thaps_hclust_0453 |
 |
 |
0.000000000093 |
0.000000041 |
0.00016 |
lowSi_TMEVA | 1.000000 | -0.00447 |
| Thaps_hclust_0453 |
 |
 |
0.000000000093 |
0.000000041 |
0.00016 |
highlight_arrays | 0.513000 | 0.0782 |
| Thaps_hclust_0453 |
 |
 |
0.000000000093 |
0.000000041 |
0.00016 |
diel_light_vs_dark | 0.629000 | -0.0826 |
| Thaps_hclust_0453 |
 |
 |
0.000000000093 |
0.000000041 |
0.00016 |
lowFe_KTKB_Day3 | 0.889000 | 0.0296 |
| Thaps_hclust_0453 |
 |
 |
0.000000000093 |
0.000000041 |
0.00016 |
lowFe_KTKB_Day5 | 0.337000 | 0.129 |
| Thaps_hclust_0453 |
 |
 |
0.000000000093 |
0.000000041 |
0.00016 |
BaP | 0.000370 | -1.31 |
| Thaps_hclust_0453 |
 |
 |
0.000000000093 |
0.000000041 |
0.00016 |
exponential_vs_stationary_24highlight | 0.267000 | -0.0782 |
| Thaps_hclust_0453 |
 |
 |
0.000000000093 |
0.000000041 |
0.00016 |
co2_elevated_stat_arrays | 0.206000 | 0.226 |
| Thaps_hclust_0453 |
 |
 |
0.000000000093 |
0.000000041 |
0.00016 |
lowtemp_TMEVA | 0.441000 | -0.134 |
| Thaps_hclust_0453 |
 |
 |
0.000000000093 |
0.000000041 |
0.00016 |
highpH_TMEVA | 0.851000 | -0.0293 |
| Thaps_hclust_0453 |
 |
 |
0.000000000093 |
0.000000041 |
0.00016 |
co2_elevated_expo_arrays | 0.985000 | 0.00819 |
| Thaps_hclust_0453 |
 |
 |
0.000000000093 |
0.000000041 |
0.00016 |
lowFe_TMEVA | 0.911000 | -0.0437 |
| Title | Cluster Plot | Dendrogram | e-value | e-value | e-value | Condition | Condition FDR | Condition Difference |
|---|---|---|---|---|---|---|---|---|
| Thaps_hclust_0452 |
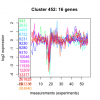 |
 |
84 |
200 |
220 |
lowFe_TMEVA | 0.625000 | -0.17 |
| Thaps_hclust_0452 |
 |
 |
84 |
200 |
220 |
exponential_vs_stationary_24light | 0.789000 | -0.121 |
| Thaps_hclust_0452 |
 |
 |
84 |
200 |
220 |
lowN_TMEVA | 0.712000 | 0.152 |
| Thaps_hclust_0452 |
 |
 |
84 |
200 |
220 |
diel_exponential_vs_stationary | 0.395000 | 0.181 |
| Thaps_hclust_0452 |
 |
 |
84 |
200 |
220 |
lowSi_TMEVA | 0.839000 | 0.228 |
| Thaps_hclust_0452 |
 |
 |
84 |
200 |
220 |
highlight_arrays | 0.018200 | 0.391 |
| Thaps_hclust_0452 |
 |
 |
84 |
200 |
220 |
diel_light_vs_dark | 0.686000 | -0.118 |
| Thaps_hclust_0452 |
 |
 |
84 |
200 |
220 |
lowFe_KTKB_Day3 | 0.002380 | -0.795 |
| Thaps_hclust_0452 |
 |
 |
84 |
200 |
220 |
lowFe_KTKB_Day5 | 0.586000 | -0.13 |
| Thaps_hclust_0452 |
 |
 |
84 |
200 |
220 |
BaP | 0.000370 | -0.871 |
| Thaps_hclust_0452 |
 |
 |
84 |
200 |
220 |
exponential_vs_stationary_24highlight | 0.806000 | 0.0341 |
| Thaps_hclust_0452 |
 |
 |
84 |
200 |
220 |
co2_elevated_stat_arrays | 0.741000 | 0.094 |
| Thaps_hclust_0452 |
 |
 |
84 |
200 |
220 |
lowtemp_TMEVA | 0.704000 | -0.117 |
| Thaps_hclust_0452 |
 |
 |
84 |
200 |
220 |
highpH_TMEVA | 0.358000 | -0.168 |
| Thaps_hclust_0452 |
 |
 |
84 |
200 |
220 |
co2_elevated_expo_arrays | 0.943000 | -0.0398 |
| Title | Cluster Plot | Dendrogram | e-value | e-value | e-value | Condition | Condition FDR | Condition Difference |
|---|---|---|---|---|---|---|---|---|
| Thaps_hclust_0451 |
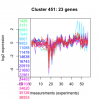 |
 |
10 |
0.0026 |
160 |
co2_elevated_expo_arrays | 0.740000 | 0.0922 |
| Thaps_hclust_0451 |
 |
 |
10 |
0.0026 |
160 |
lowFe_TMEVA | 0.553000 | -0.172 |
| Thaps_hclust_0451 |
 |
 |
10 |
0.0026 |
160 |
exponential_vs_stationary_24light | 0.022100 | -0.649 |
| Thaps_hclust_0451 |
 |
 |
10 |
0.0026 |
160 |
lowN_TMEVA | 0.633000 | 0.175 |
| Thaps_hclust_0451 |
 |
 |
10 |
0.0026 |
160 |
diel_exponential_vs_stationary | 0.014600 | -0.386 |
| Thaps_hclust_0451 |
 |
 |
10 |
0.0026 |
160 |
lowSi_TMEVA | 1.000000 | 0.00553 |
| Thaps_hclust_0451 |
 |
 |
10 |
0.0026 |
160 |
highlight_arrays | 0.001940 | 0.427 |
| Thaps_hclust_0451 |
 |
 |
10 |
0.0026 |
160 |
diel_light_vs_dark | 0.446000 | -0.167 |
| Thaps_hclust_0451 |
 |
 |
10 |
0.0026 |
160 |
lowFe_KTKB_Day3 | 0.406000 | -0.199 |
| Thaps_hclust_0451 |
 |
 |
10 |
0.0026 |
160 |
lowFe_KTKB_Day5 | 0.660000 | 0.0903 |
| Thaps_hclust_0451 |
 |
 |
10 |
0.0026 |
160 |
BaP | 0.000370 | -1.3 |
| Thaps_hclust_0451 |
 |
 |
10 |
0.0026 |
160 |
exponential_vs_stationary_24highlight | 0.000926 | -0.32 |
| Thaps_hclust_0451 |
 |
 |
10 |
0.0026 |
160 |
co2_elevated_stat_arrays | 0.626000 | 0.126 |
| Thaps_hclust_0451 |
 |
 |
10 |
0.0026 |
160 |
lowtemp_TMEVA | 0.818000 | 0.0659 |
| Thaps_hclust_0451 |
 |
 |
10 |
0.0026 |
160 |
highpH_TMEVA | 0.254000 | -0.173 |
| Title | Cluster Plot | Dendrogram | e-value | e-value | e-value | Condition | Condition FDR | Condition Difference |
|---|---|---|---|---|---|---|---|---|
| Thaps_hclust_0450 |
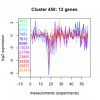 |
 |
0.00076 |
0.024 |
0.16 |
highpH_TMEVA | 0.741000 | 0.0803 |
| Thaps_hclust_0450 |
 |
 |
0.00076 |
0.024 |
0.16 |
co2_elevated_expo_arrays | 0.021800 | 0.38 |
| Thaps_hclust_0450 |
 |
 |
0.00076 |
0.024 |
0.16 |
lowFe_TMEVA | 0.349000 | -0.32 |
| Thaps_hclust_0450 |
 |
 |
0.00076 |
0.024 |
0.16 |
exponential_vs_stationary_24light | 0.015000 | -0.947 |
| Thaps_hclust_0450 |
 |
 |
0.00076 |
0.024 |
0.16 |
lowN_TMEVA | 0.558000 | 0.25 |
| Thaps_hclust_0450 |
 |
 |
0.00076 |
0.024 |
0.16 |
diel_exponential_vs_stationary | 0.151000 | -0.328 |
| Thaps_hclust_0450 |
 |
 |
0.00076 |
0.024 |
0.16 |
lowSi_TMEVA | 0.861000 | -0.202 |
| Thaps_hclust_0450 |
 |
 |
0.00076 |
0.024 |
0.16 |
highlight_arrays | 0.002540 | 0.577 |
| Thaps_hclust_0450 |
 |
 |
0.00076 |
0.024 |
0.16 |
diel_light_vs_dark | 0.000485 | -1 |
| Thaps_hclust_0450 |
 |
 |
0.00076 |
0.024 |
0.16 |
lowFe_KTKB_Day3 | 0.002990 | -0.898 |
| Thaps_hclust_0450 |
 |
 |
0.00076 |
0.024 |
0.16 |
lowFe_KTKB_Day5 | 0.614000 | -0.142 |
| Thaps_hclust_0450 |
 |
 |
0.00076 |
0.024 |
0.16 |
BaP | 0.000370 | -1.63 |
| Thaps_hclust_0450 |
 |
 |
0.00076 |
0.024 |
0.16 |
exponential_vs_stationary_24highlight | 0.003230 | -0.414 |
| Thaps_hclust_0450 |
 |
 |
0.00076 |
0.024 |
0.16 |
co2_elevated_stat_arrays | 0.088500 | 0.449 |
| Thaps_hclust_0450 |
 |
 |
0.00076 |
0.024 |
0.16 |
lowtemp_TMEVA | 0.186000 | 0.44 |
| Title | Cluster Plot | Dendrogram | e-value | e-value | e-value | Condition | Condition FDR | Condition Difference |
|---|---|---|---|---|---|---|---|---|
| Thaps_hclust_0449 |
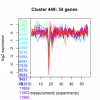 |
 |
0.0000000011 |
0.012 |
3.5 |
lowtemp_TMEVA | 0.740000 | -0.0759 |
| Thaps_hclust_0449 |
 |
 |
0.0000000011 |
0.012 |
3.5 |
highpH_TMEVA | 0.392000 | -0.115 |
| Thaps_hclust_0449 |
 |
 |
0.0000000011 |
0.012 |
3.5 |
co2_elevated_expo_arrays | 0.944000 | 0.0345 |
| Thaps_hclust_0449 |
 |
 |
0.0000000011 |
0.012 |
3.5 |
lowFe_TMEVA | 0.996000 | -0.00728 |
| Thaps_hclust_0449 |
 |
 |
0.0000000011 |
0.012 |
3.5 |
exponential_vs_stationary_24light | 0.787000 | 0.0992 |
| Thaps_hclust_0449 |
 |
 |
0.0000000011 |
0.012 |
3.5 |
lowN_TMEVA | 0.684000 | -0.148 |
| Thaps_hclust_0449 |
 |
 |
0.0000000011 |
0.012 |
3.5 |
diel_exponential_vs_stationary | 0.395000 | -0.127 |
| Thaps_hclust_0449 |
 |
 |
0.0000000011 |
0.012 |
3.5 |
lowSi_TMEVA | 1.000000 | -0.0133 |
| Thaps_hclust_0449 |
 |
 |
0.0000000011 |
0.012 |
3.5 |
highlight_arrays | 0.011500 | -0.301 |
| Thaps_hclust_0449 |
 |
 |
0.0000000011 |
0.012 |
3.5 |
diel_light_vs_dark | 0.731000 | 0.0702 |
| Thaps_hclust_0449 |
 |
 |
0.0000000011 |
0.012 |
3.5 |
lowFe_KTKB_Day3 | 0.509000 | -0.136 |
| Thaps_hclust_0449 |
 |
 |
0.0000000011 |
0.012 |
3.5 |
lowFe_KTKB_Day5 | 0.964000 | -0.00946 |
| Thaps_hclust_0449 |
 |
 |
0.0000000011 |
0.012 |
3.5 |
BaP | 0.000370 | -1.13 |
| Thaps_hclust_0449 |
 |
 |
0.0000000011 |
0.012 |
3.5 |
exponential_vs_stationary_24highlight | 0.722000 | 0.0333 |
| Thaps_hclust_0449 |
 |
 |
0.0000000011 |
0.012 |
3.5 |
co2_elevated_stat_arrays | 0.044700 | -0.349 |
| Title | Cluster Plot | Dendrogram | e-value | e-value | e-value | Condition | Condition FDR | Condition Difference |
|---|---|---|---|---|---|---|---|---|
| Thaps_hclust_0448 |
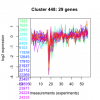 |
 |
0.0000000026 |
0.00021 |
8.2 |
co2_elevated_stat_arrays | 0.218000 | -0.25 |
| Thaps_hclust_0448 |
 |
 |
0.0000000026 |
0.00021 |
8.2 |
lowtemp_TMEVA | 0.263000 | -0.241 |
| Thaps_hclust_0448 |
 |
 |
0.0000000026 |
0.00021 |
8.2 |
highpH_TMEVA | 0.209000 | -0.174 |
| Thaps_hclust_0448 |
 |
 |
0.0000000026 |
0.00021 |
8.2 |
co2_elevated_expo_arrays | 0.985000 | -0.0106 |
| Thaps_hclust_0448 |
 |
 |
0.0000000026 |
0.00021 |
8.2 |
lowFe_TMEVA | 0.933000 | -0.0358 |
| Thaps_hclust_0448 |
 |
 |
0.0000000026 |
0.00021 |
8.2 |
exponential_vs_stationary_24light | 0.547000 | -0.191 |
| Thaps_hclust_0448 |
 |
 |
0.0000000026 |
0.00021 |
8.2 |
lowN_TMEVA | 0.464000 | -0.241 |
| Thaps_hclust_0448 |
 |
 |
0.0000000026 |
0.00021 |
8.2 |
diel_exponential_vs_stationary | 0.213000 | -0.185 |
| Thaps_hclust_0448 |
 |
 |
0.0000000026 |
0.00021 |
8.2 |
lowSi_TMEVA | 1.000000 | -0.00491 |
| Thaps_hclust_0448 |
 |
 |
0.0000000026 |
0.00021 |
8.2 |
highlight_arrays | 0.043100 | -0.259 |
| Thaps_hclust_0448 |
 |
 |
0.0000000026 |
0.00021 |
8.2 |
diel_light_vs_dark | 0.751000 | -0.0726 |
| Thaps_hclust_0448 |
 |
 |
0.0000000026 |
0.00021 |
8.2 |
lowFe_KTKB_Day3 | 0.535000 | -0.139 |
| Thaps_hclust_0448 |
 |
 |
0.0000000026 |
0.00021 |
8.2 |
lowFe_KTKB_Day5 | 0.820000 | 0.043 |
| Thaps_hclust_0448 |
 |
 |
0.0000000026 |
0.00021 |
8.2 |
BaP | 0.000370 | -1.12 |
| Thaps_hclust_0448 |
 |
 |
0.0000000026 |
0.00021 |
8.2 |
exponential_vs_stationary_24highlight | 0.300000 | -0.094 |
| Title | Cluster Plot | Dendrogram | e-value | e-value | e-value | Condition | Condition FDR | Condition Difference |
|---|---|---|---|---|---|---|---|---|
| Thaps_hclust_0447 |
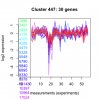 |
 |
0.0005 |
0.0031 |
0.0041 |
exponential_vs_stationary_24highlight | 0.715000 | 0.0353 |
| Thaps_hclust_0447 |
 |
 |
0.0005 |
0.0031 |
0.0041 |
co2_elevated_stat_arrays | 0.043600 | -0.376 |
| Thaps_hclust_0447 |
 |
 |
0.0005 |
0.0031 |
0.0041 |
lowtemp_TMEVA | 0.999000 | -0.00385 |
| Thaps_hclust_0447 |
 |
 |
0.0005 |
0.0031 |
0.0041 |
highpH_TMEVA | 0.328000 | -0.136 |
| Thaps_hclust_0447 |
 |
 |
0.0005 |
0.0031 |
0.0041 |
co2_elevated_expo_arrays | 0.873000 | -0.0612 |
