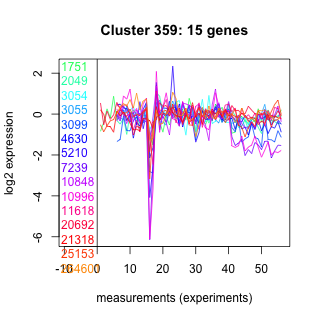
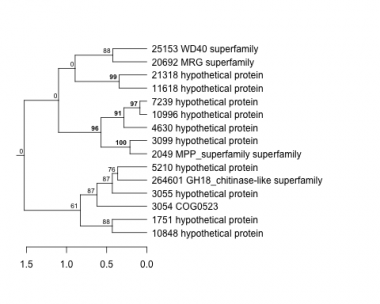
Thaps_hclust_0359 Hierarchical Clustering
Thalassiosira pseudonana
| GO ID | Go Term | p-value | q-value | Cluster |
|---|---|---|---|---|
| GO:0005975 | carbohydrate metabolism | 0.0458082 | 1 | Thaps_hclust_0359 |
| GO:0006355 | regulation of transcription, DNA-dependent | 0.178613 | 1 | Thaps_hclust_0359 |
| GO:0008152 | metabolism | 0.231829 | 1 | Thaps_hclust_0359 |
|
1751 : hypothetical protein |
3099 : hypothetical protein |
10848 : hypothetical protein |
21318 : hypothetical protein |
|
2049 : MPP_superfamily superfamily |
4630 : hypothetical protein |
10996 : hypothetical protein |
25153 : WD40 superfamily |
|
3054 : COG0523 |
5210 : hypothetical protein |
11618 : hypothetical protein |
264601 : GH18_chitinase-like superfamily |
|
3055 : hypothetical protein |
7239 : hypothetical protein |
20692 : MRG superfamily |
| Condition | Condition | Difference | FDR |
|---|---|---|---|
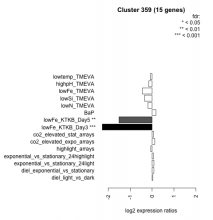
| diel_light_vs_dark | diel_light_vs_dark | 0.034 | 0.94 |
| lowFe_KTKB_Day3 | lowFe_KTKB_Day3 | -2.280 | 0.000862 |
| lowFe_KTKB_Day5 | lowFe_KTKB_Day5 | -1.510 | 0.00132 |
| BaP | BaP | 0.177 | 0.505 |
| exponential_vs_stationary_24highlight | exponential_vs_stationary_24highlight | 0.063 | 0.645 |
| co2_elevated_stat_arrays | co2_elevated_stat_arrays | 0.072 | 0.808 |
| lowtemp_TMEVA | lowtemp_TMEVA | -0.083 | 0.803 |
| highpH_TMEVA | highpH_TMEVA | -0.152 | 0.423 |
| co2_elevated_expo_arrays | co2_elevated_expo_arrays | 0.124 | 0.616 |
| lowFe_TMEVA | lowFe_TMEVA | -0.451 | 0.133 |
| exponential_vs_stationary_24light | exponential_vs_stationary_24light | 0.087 | 0.853 |
| lowN_TMEVA | lowN_TMEVA | -0.189 | 0.643 |
| diel_exponential_vs_stationary | diel_exponential_vs_stationary | 0.085 | 0.733 |
| lowSi_TMEVA | lowSi_TMEVA | -0.346 | 0.616 |
| highlight_arrays | highlight_arrays | -0.059 | 0.781 |


