Thaps_hclust_0363 Hierarchical Clustering
Thalassiosira pseudonana
| Cluster Plot | Conditions Plot | Dendrogram |
|---|---|---|
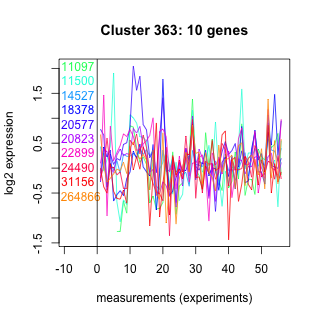 |
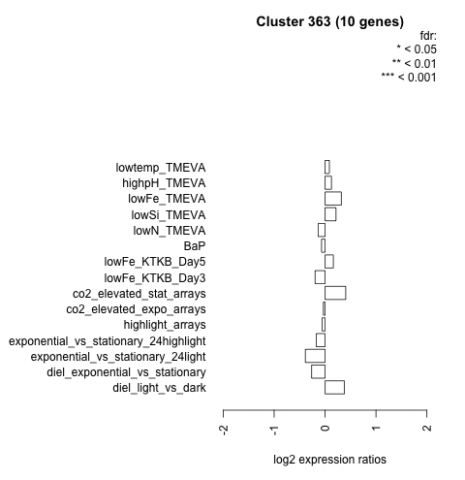 |
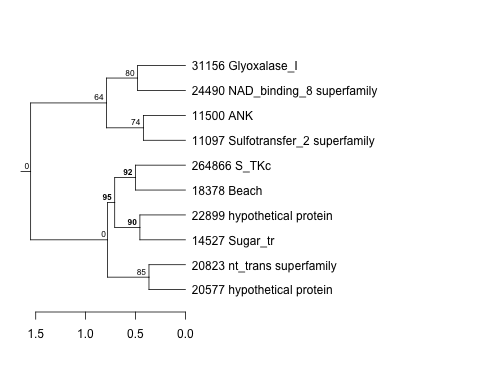 |
| GO ID | Go Term | p-value | q-value | Cluster |
|---|---|---|---|---|
| GO:0008643 | carbohydrate transport | 0.0143942 | 1 | Thaps_hclust_0363 |
| GO:0009058 | biosynthesis | 0.0555976 | 1 | Thaps_hclust_0363 |
| GO:0005975 | carbohydrate metabolism | 0.0751903 | 1 | Thaps_hclust_0363 |
| GO:0006810 | transport | 0.176337 | 1 | Thaps_hclust_0363 |
| GO:0006468 | protein amino acid phosphorylation | 0.201698 | 1 | Thaps_hclust_0363 |
| Condition | Condition | Difference | FDR |
|---|---|---|---|
| diel_light_vs_dark | diel_light_vs_dark | 0.379 | 0.199 |
| lowFe_KTKB_Day3 | lowFe_KTKB_Day3 | -0.195 | 0.603 |
| lowFe_KTKB_Day5 | lowFe_KTKB_Day5 | 0.163 | 0.584 |
| BaP | BaP | -0.069 | 0.855 |
| exponential_vs_stationary_24highlight | exponential_vs_stationary_24highlight | -0.173 | 0.25 |
| co2_elevated_stat_arrays | co2_elevated_stat_arrays | 0.405 | 0.154 |
| lowtemp_TMEVA | lowtemp_TMEVA | 0.085 | 0.828 |
| highpH_TMEVA | highpH_TMEVA | 0.126 | 0.6 |
| co2_elevated_expo_arrays | co2_elevated_expo_arrays | -0.034 | 0.955 |
| lowFe_TMEVA | lowFe_TMEVA | 0.320 | 0.382 |
| exponential_vs_stationary_24light | exponential_vs_stationary_24light | -0.386 | 0.365 |
| lowN_TMEVA | lowN_TMEVA | -0.135 | 0.761 |
| diel_exponential_vs_stationary | diel_exponential_vs_stationary | -0.264 | 0.302 |
| lowSi_TMEVA | lowSi_TMEVA | 0.214 | 0.854 |
| highlight_arrays | highlight_arrays | -0.057 | 0.819 |