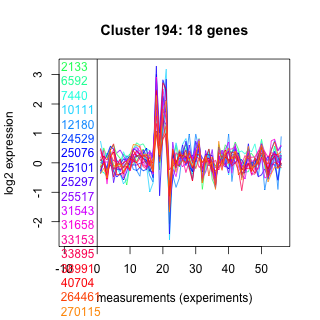
Thaps_hclust_0194 Hierarchical Clustering
Thalassiosira pseudonana
| Cluster Plot | Conditions Plot | Dendrogram |
|---|---|---|
 |
 |
 |
| GO ID | Go Term | p-value | q-value | Cluster |
|---|---|---|---|---|
| GO:0006811 | ion transport | 0.025776 | 1 | Thaps_hclust_0194 |
| GO:0006813 | potassium ion transport | 0.031426 | 1 | Thaps_hclust_0194 |
| GO:0006812 | cation transport | 0.06063 | 1 | Thaps_hclust_0194 |
| GO:0005975 | carbohydrate metabolism | 0.103679 | 1 | Thaps_hclust_0194 |
| GO:0006457 | protein folding | 0.173725 | 1 | Thaps_hclust_0194 |
| GO:0006118 | electron transport | 0.327122 | 1 | Thaps_hclust_0194 |
| GO:0006508 | proteolysis and peptidolysis | 0.349482 | 1 | Thaps_hclust_0194 |
|
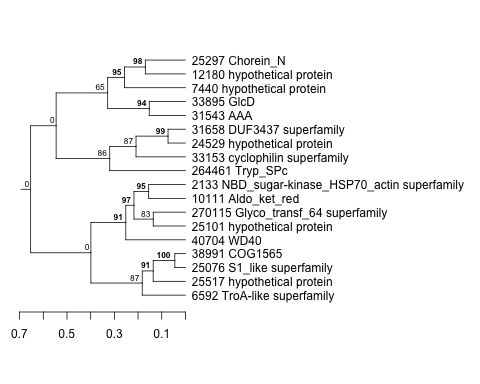
2133 : NBD_sugar-kinase_HSP70_actin superfamily |
24529 : hypothetical protein |
31543 : AAA |
38991 : COG1565 |
|
6592 : TroA-like superfamily |
25076 : S1_like superfamily |
31658 : DUF3437 superfamily |
40704 : WD40 |
|
7440 : hypothetical protein |
25101 : hypothetical protein |
33153 : cyclophilin superfamily |
264461 : Tryp_SPc |
|
10111 : Aldo_ket_red |
25297 : Chorein_N |
33895 : GlcD |
270115 : Glyco_transf_64 superfamily |
|
12180 : hypothetical protein |
25517 : hypothetical protein |
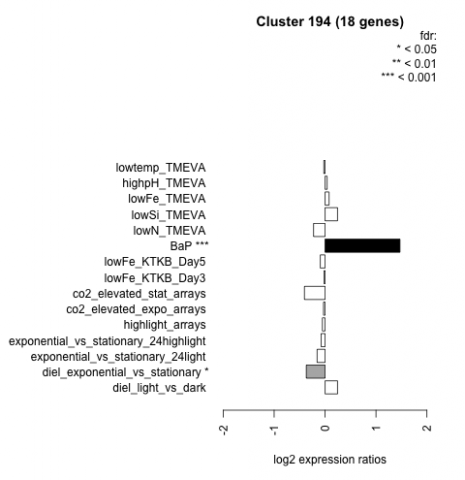
| Condition | Condition | Difference | FDR |
|---|---|---|---|
| diel_light_vs_dark | diel_light_vs_dark | 0.245 | 0.28 |
| lowFe_KTKB_Day3 | lowFe_KTKB_Day3 | -0.019 | 0.954 |
| lowFe_KTKB_Day5 | lowFe_KTKB_Day5 | -0.094 | 0.684 |
| BaP | BaP | 1.470 | 0.00037 |
| exponential_vs_stationary_24highlight | exponential_vs_stationary_24highlight | -0.077 | 0.541 |
| co2_elevated_stat_arrays | co2_elevated_stat_arrays | -0.405 | 0.0755 |
| lowtemp_TMEVA | lowtemp_TMEVA | -0.024 | 0.944 |
| highpH_TMEVA | highpH_TMEVA | 0.040 | 0.854 |
| co2_elevated_expo_arrays | co2_elevated_expo_arrays | -0.030 | 0.959 |
| lowFe_TMEVA | lowFe_TMEVA | 0.079 | 0.853 |
| exponential_vs_stationary_24light | exponential_vs_stationary_24light | -0.156 | 0.696 |
| lowN_TMEVA | lowN_TMEVA | -0.226 | 0.542 |
| diel_exponential_vs_stationary | diel_exponential_vs_stationary | -0.368 | 0.0443 |
| lowSi_TMEVA | lowSi_TMEVA | 0.245 | 0.814 |
| highlight_arrays | highlight_arrays | -0.053 | 0.79 |