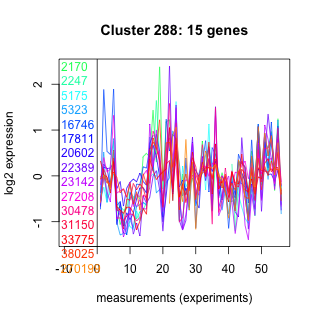
Thaps_hclust_0288 Hierarchical Clustering
Thalassiosira pseudonana
| Cluster Plot | Conditions Plot | Dendrogram |
|---|---|---|
 |
 |
 |
| GO ID | Go Term | p-value | q-value | Cluster |
|---|---|---|---|---|
| GO:0006412 | protein biosynthesis | 0.00195759 | 1 | Thaps_hclust_0288 |
| GO:0009231 | riboflavin biosynthesis | 0.00988766 | 1 | Thaps_hclust_0288 |
| GO:0000105 | histidine biosynthesis | 0.0131645 | 1 | Thaps_hclust_0288 |
| GO:0006865 | amino acid transport | 0.0470024 | 1 | Thaps_hclust_0288 |
| GO:0006810 | transport | 0.266912 | 1 | Thaps_hclust_0288 |
| GO:0006508 | proteolysis and peptidolysis | 0.38827 | 1 | Thaps_hclust_0288 |
|
2170 : hypothetical protein |
16746 : Mito_carr |
23142 : Aa_trans superfamily |
33775 : MetAP1 |
|
2247 : PLN02369 |
17811 : NA |
27208 : CCC1_like superfamily |
38025 : Pep_deformylase |
|
5175 : Flavokinase |
20602 : Ribosomal_L22 superfamily |
30478 : (hisH) PLN02617 |
270199 : (Tpt1) triose phosphate/phosphate translocator |
|
5323 : COG0802 |
22389 : hypothetical protein |
31150 : rpsI |
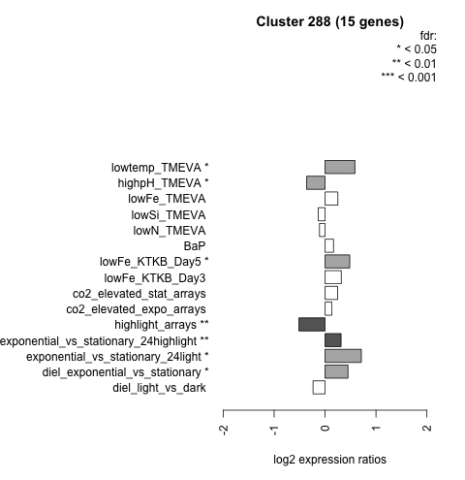
| Condition | Condition | Difference | FDR |
|---|---|---|---|
| diel_light_vs_dark | diel_light_vs_dark | -0.235 | 0.357 |
| lowFe_KTKB_Day3 | lowFe_KTKB_Day3 | 0.319 | 0.244 |
| lowFe_KTKB_Day5 | lowFe_KTKB_Day5 | 0.485 | 0.027 |
| BaP | BaP | 0.167 | 0.537 |
| exponential_vs_stationary_24highlight | exponential_vs_stationary_24highlight | 0.315 | 0.00752 |
| co2_elevated_stat_arrays | co2_elevated_stat_arrays | 0.246 | 0.332 |
| lowtemp_TMEVA | lowtemp_TMEVA | 0.587 | 0.0421 |
| highpH_TMEVA | highpH_TMEVA | -0.362 | 0.0426 |
| co2_elevated_expo_arrays | co2_elevated_expo_arrays | 0.133 | 0.58 |
| lowFe_TMEVA | lowFe_TMEVA | 0.250 | 0.422 |
| exponential_vs_stationary_24light | exponential_vs_stationary_24light | 0.713 | 0.0409 |
| lowN_TMEVA | lowN_TMEVA | -0.110 | 0.784 |
| diel_exponential_vs_stationary | diel_exponential_vs_stationary | 0.450 | 0.024 |
| lowSi_TMEVA | lowSi_TMEVA | -0.134 | 0.976 |
| highlight_arrays | highlight_arrays | -0.513 | 0.00284 |