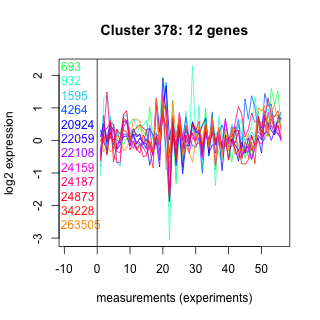
Thaps_hclust_0378 Hierarchical Clustering
Thalassiosira pseudonana
| Cluster Plot | Conditions Plot | Dendrogram |
|---|---|---|
 |
 |
 |
| GO ID | Go Term | p-value | q-value | Cluster |
|---|---|---|---|---|
| GO:0009086 | methionine biosynthesis | 0.00247959 | 1 | Thaps_hclust_0378 |
| GO:0009396 | folic acid and derivative biosynthesis | 0.00865617 | 1 | Thaps_hclust_0378 |
| GO:0006520 | amino acid metabolism | 0.0257813 | 1 | Thaps_hclust_0378 |
| GO:0009190 | cyclic nucleotide biosynthesis | 0.026995 | 1 | Thaps_hclust_0378 |
| GO:0007242 | intracellular signaling cascade | 0.0510063 | 1 | Thaps_hclust_0378 |
| GO:0006355 | regulation of transcription, DNA-dependent | 0.325408 | 1 | Thaps_hclust_0378 |
|
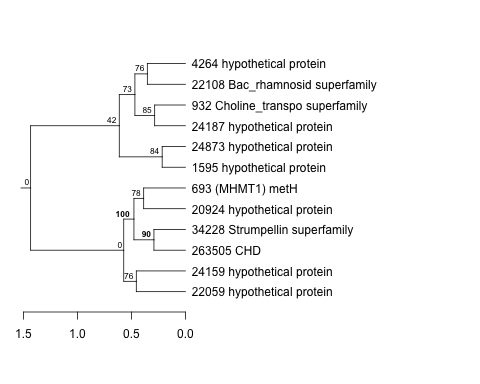
693 : (MHMT1) metH |
4264 : hypothetical protein |
22108 : Bac_rhamnosid superfamily |
24873 : hypothetical protein |
|
932 : Choline_transpo superfamily |
20924 : hypothetical protein |
24159 : hypothetical protein |
34228 : Strumpellin superfamily |
|
1595 : hypothetical protein |
22059 : hypothetical protein |
24187 : hypothetical protein |
263505 : CHD |
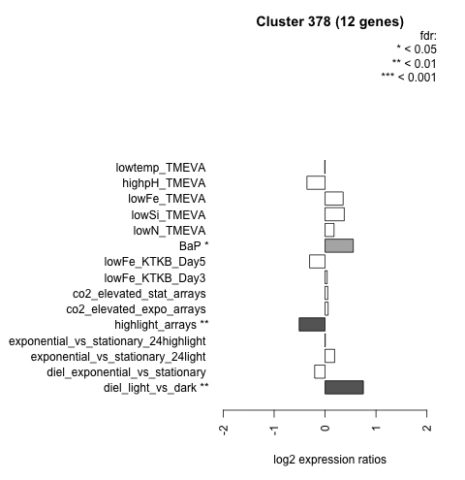
| Condition | Condition | Difference | FDR |
|---|---|---|---|
| diel_light_vs_dark | diel_light_vs_dark | 0.752 | 0.00177 |
| lowFe_KTKB_Day3 | lowFe_KTKB_Day3 | 0.041 | 0.926 |
| lowFe_KTKB_Day5 | lowFe_KTKB_Day5 | -0.304 | 0.249 |
| BaP | BaP | 0.553 | 0.0445 |
| exponential_vs_stationary_24highlight | exponential_vs_stationary_24highlight | 0.003 | 0.986 |
| co2_elevated_stat_arrays | co2_elevated_stat_arrays | 0.054 | 0.861 |
| lowtemp_TMEVA | lowtemp_TMEVA | -0.005 | 0.999 |
| highpH_TMEVA | highpH_TMEVA | -0.356 | 0.0745 |
| co2_elevated_expo_arrays | co2_elevated_expo_arrays | 0.060 | 0.903 |
| lowFe_TMEVA | lowFe_TMEVA | 0.355 | 0.3 |
| exponential_vs_stationary_24light | exponential_vs_stationary_24light | 0.188 | 0.684 |
| lowN_TMEVA | lowN_TMEVA | 0.176 | 0.695 |
| diel_exponential_vs_stationary | diel_exponential_vs_stationary | -0.204 | 0.402 |
| lowSi_TMEVA | lowSi_TMEVA | 0.377 | 0.613 |
| highlight_arrays | highlight_arrays | -0.508 | 0.00789 |