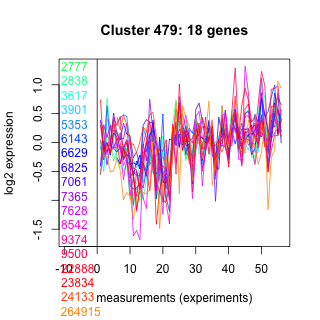
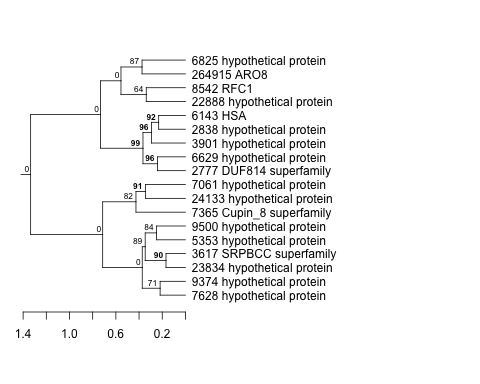
Thaps_hclust_0479 Hierarchical Clustering
Thalassiosira pseudonana
| Cluster Plot | Conditions Plot | Dendrogram |
|---|---|---|
 |
 |
 |
| GO ID | Go Term | p-value | q-value | Cluster |
|---|---|---|---|---|
| GO:0006260 | DNA replication | 0.0144209 | 1 | Thaps_hclust_0479 |
| GO:0006355 | regulation of transcription, DNA-dependent | 0.122922 | 1 | Thaps_hclust_0479 |
|
2777 : DUF814 superfamily |
6143 : HSA |
7628 : hypothetical protein |
22888 : hypothetical protein |
|
2838 : hypothetical protein |
6629 : hypothetical protein |
8542 : RFC1 |
23834 : hypothetical protein |
|
3617 : SRPBCC superfamily |
6825 : hypothetical protein |
9374 : hypothetical protein |
24133 : hypothetical protein |
|
3901 : hypothetical protein |
7061 : hypothetical protein |
9500 : hypothetical protein |
264915 : ARO8 |
|
5353 : hypothetical protein |
7365 : Cupin_8 superfamily |
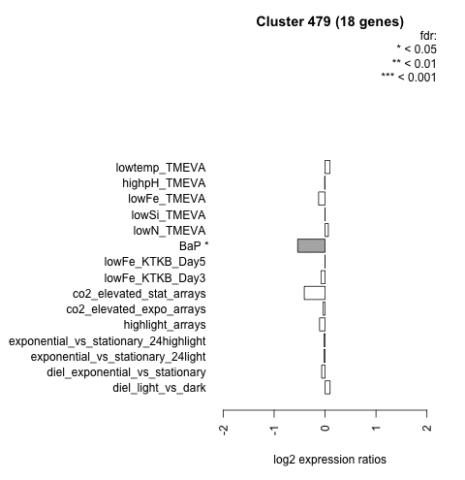
| Condition | Condition | Difference | FDR |
|---|---|---|---|
| diel_light_vs_dark | diel_light_vs_dark | 0.097 | 0.731 |
| lowFe_KTKB_Day3 | lowFe_KTKB_Day3 | -0.079 | 0.795 |
| lowFe_KTKB_Day5 | lowFe_KTKB_Day5 | 0.001 | 1 |
| BaP | BaP | -0.537 | 0.0164 |
| exponential_vs_stationary_24highlight | exponential_vs_stationary_24highlight | -0.019 | 0.899 |
| co2_elevated_stat_arrays | co2_elevated_stat_arrays | -0.408 | 0.0729 |
| lowtemp_TMEVA | lowtemp_TMEVA | 0.097 | 0.745 |
| highpH_TMEVA | highpH_TMEVA | -0.007 | 0.984 |
| co2_elevated_expo_arrays | co2_elevated_expo_arrays | -0.040 | 0.943 |
| lowFe_TMEVA | lowFe_TMEVA | -0.127 | 0.733 |
| exponential_vs_stationary_24light | exponential_vs_stationary_24light | -0.021 | 0.963 |
| lowN_TMEVA | lowN_TMEVA | 0.064 | 0.861 |
| diel_exponential_vs_stationary | diel_exponential_vs_stationary | -0.066 | 0.775 |
| lowSi_TMEVA | lowSi_TMEVA | -0.001 | 1 |
| highlight_arrays | highlight_arrays | -0.109 | 0.554 |