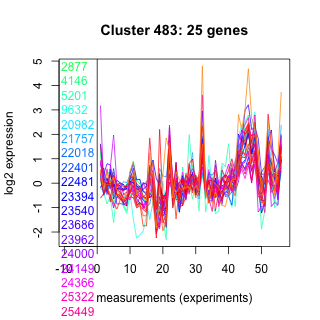
Thaps_hclust_0483 Hierarchical Clustering
Thalassiosira pseudonana
| Cluster Plot | Conditions Plot | Dendrogram |
|---|---|---|
 |
 |
 |
| GO ID | Go Term | p-value | q-value | Cluster |
|---|---|---|---|---|
| GO:0006855 | multidrug transport | 0.0100926 | 1 | Thaps_hclust_0483 |
| GO:0016310 | phosphorylation | 0.0186738 | 1 | Thaps_hclust_0483 |
| GO:0006508 | proteolysis and peptidolysis | 0.0608081 | 1 | Thaps_hclust_0483 |
| GO:0006810 | transport | 0.237879 | 1 | Thaps_hclust_0483 |
| GO:0006468 | protein amino acid phosphorylation | 0.270534 | 1 | Thaps_hclust_0483 |
| GO:0006355 | regulation of transcription, DNA-dependent | 0.368277 | 1 | Thaps_hclust_0483 |
|
2877 : hypothetical protein |
22401 : Lactamase_B |
24000 : DENN superfamily |
38973 : RabGAP-TBC |
|
4146 : hypothetical protein |
22481 : hypothetical protein |
24149 : hypothetical protein |
40831 : Tryp_SPc |
|
5201 : MATE_like superfamily |
23394 : GAT_1 superfamily |
24366 : hypothetical protein |
261233 : (PDK1_1) BCDHK_Adom3 |
|
9632 : hypothetical protein |
23540 : glyco_like_mftF |
25322 : FlaRed superfamily |
262855 : TLDc |
|
20982 : Grp1_Fun34_YaaH superfamily |
23686 : Sun |
25449 : hypothetical protein |
264804 : hypothetical protein |
|
21757 : PI-PLCc_GDPD_SF superfamily |
23962 : hypothetical protein |
25781 : hypothetical protein |
268516 : hypothetical protein |
|
22018 : (Tp_HSF_2.7h) HSF_DNA-bind superfamily |
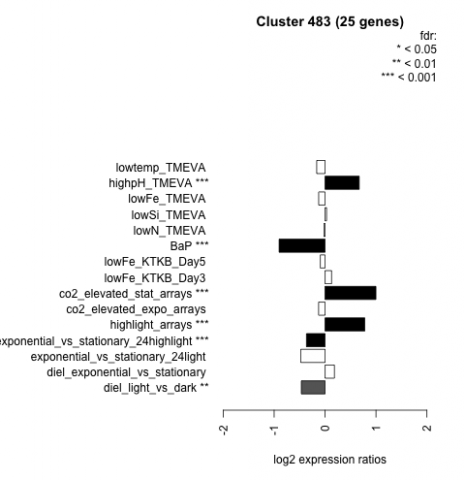
| Condition | Condition | Difference | FDR |
|---|---|---|---|
| diel_light_vs_dark | diel_light_vs_dark | -0.466 | 0.00682 |
| lowFe_KTKB_Day3 | lowFe_KTKB_Day3 | 0.129 | 0.601 |
| lowFe_KTKB_Day5 | lowFe_KTKB_Day5 | -0.094 | 0.642 |
| BaP | BaP | -0.902 | 0.00037 |
| exponential_vs_stationary_24highlight | exponential_vs_stationary_24highlight | -0.365 | 0.000526 |
| co2_elevated_stat_arrays | co2_elevated_stat_arrays | 0.999 | 0.000658 |
| lowtemp_TMEVA | lowtemp_TMEVA | -0.164 | 0.48 |
| highpH_TMEVA | highpH_TMEVA | 0.671 | 0.000725 |
| co2_elevated_expo_arrays | co2_elevated_expo_arrays | -0.127 | 0.514 |
| lowFe_TMEVA | lowFe_TMEVA | -0.125 | 0.709 |
| exponential_vs_stationary_24light | exponential_vs_stationary_24light | -0.477 | 0.0894 |
| lowN_TMEVA | lowN_TMEVA | -0.021 | 0.959 |
| diel_exponential_vs_stationary | diel_exponential_vs_stationary | 0.184 | 0.262 |
| lowSi_TMEVA | lowSi_TMEVA | 0.030 | 1 |
| highlight_arrays | highlight_arrays | 0.780 | 0.000442 |