Hierarchical Clusters
Displaying 6701 - 6800 of 7500
| Title | Cluster Plot | Dendrogram | e-value | e-value | e-value | Condition | Condition FDR | Condition Difference |
|---|---|---|---|---|---|---|---|---|
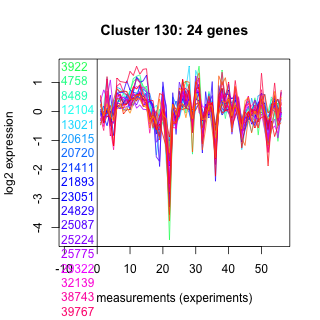
| Thaps_hclust_0130 |
 |
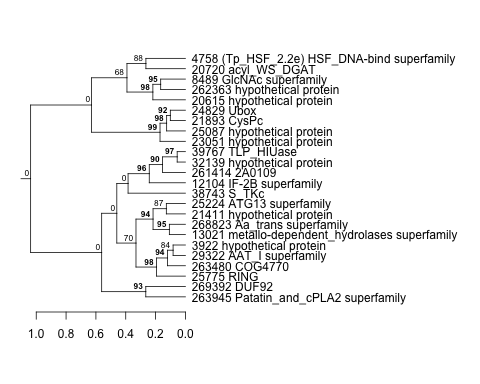 |
0.64 |
15 |
13 |
highlight_arrays | 0.854000 | -0.032 |
| Thaps_hclust_0130 |
|
|
0.64 |
15 |
13 |
diel_light_vs_dark | 0.102000 | 0.303 |
| Thaps_hclust_0130 |
|
|
0.64 |
15 |
13 |
lowFe_KTKB_Day3 | 0.926000 | -0.0252 |
| Thaps_hclust_0130 |
|
|
0.64 |
15 |
13 |
lowFe_KTKB_Day5 | 0.725000 | -0.0708 |
| Thaps_hclust_0130 |
|
|
0.64 |
15 |
13 |
BaP | 0.044400 | -0.385 |
| Title | Cluster Plot | Dendrogram | e-value | e-value | e-value | Condition | Condition FDR | Condition Difference |
|---|---|---|---|---|---|---|---|---|
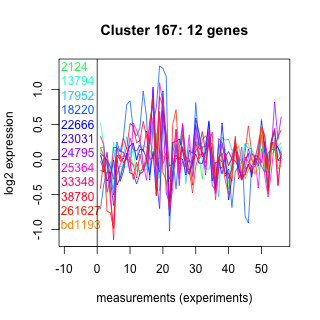
| Thaps_hclust_0167 |
 |
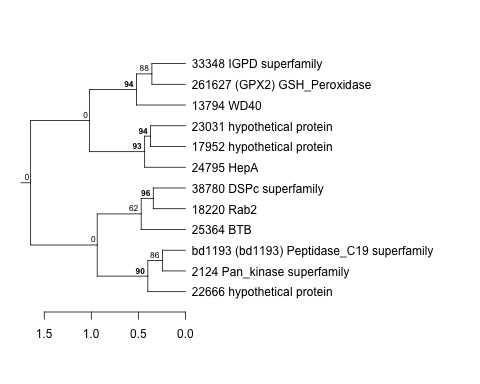 |
1 |
15 |
160 |
diel_light_vs_dark | 0.940000 | -0.0375 |
| Thaps_hclust_0167 |
|
|
1 |
15 |
160 |
lowFe_KTKB_Day3 | 0.604000 | 0.175 |
| Thaps_hclust_0167 |
|
|
1 |
15 |
160 |
lowFe_KTKB_Day5 | 0.042100 | 0.546 |
| Thaps_hclust_0167 |
|
|
1 |
15 |
160 |
BaP | 0.398000 | 0.243 |
| Thaps_hclust_0167 |
|
|
1 |
15 |
160 |
exponential_vs_stationary_24highlight | 0.614000 | -0.0757 |
| Title | Cluster Plot | Dendrogram | e-value | e-value | e-value | Condition | Condition FDR | Condition Difference |
|---|---|---|---|---|---|---|---|---|
| Thaps_hclust_0494 |
 |
 |
6.7 |
15 |
60 |
highpH_TMEVA | 0.000725 | 0.57 |
| Thaps_hclust_0494 |
|
|
6.7 |
15 |
60 |
co2_elevated_expo_arrays | 0.068700 | -0.252 |
| Thaps_hclust_0494 |
|
|
6.7 |
15 |
60 |
lowFe_TMEVA | 0.001040 | -1.24 |
| Thaps_hclust_0494 |
|
|
6.7 |
15 |
60 |
exponential_vs_stationary_24light | 0.406000 | -0.278 |
| Thaps_hclust_0494 |
|
|
6.7 |
15 |
60 |
lowN_TMEVA | 0.842000 | 0.08 |
| Title | Cluster Plot | Dendrogram | e-value | e-value | e-value | Condition | Condition FDR | Condition Difference |
|---|---|---|---|---|---|---|---|---|
| Thaps_hclust_0422 |
 |
 |
1.9 |
15 |
0.0027 |
co2_elevated_stat_arrays | 0.615000 | 0.128 |
| Thaps_hclust_0422 |
|
|
1.9 |
15 |
0.0027 |
lowtemp_TMEVA | 0.023300 | -0.561 |
| Thaps_hclust_0422 |
|
|
1.9 |
15 |
0.0027 |
highpH_TMEVA | 0.964000 | 0.015 |
| Thaps_hclust_0422 |
|
|
1.9 |
15 |
0.0027 |
co2_elevated_expo_arrays | 0.145000 | 0.212 |
| Thaps_hclust_0422 |
|
|
1.9 |
15 |
0.0027 |
lowFe_TMEVA | 0.216000 | -0.33 |
| Title | Cluster Plot | Dendrogram | e-value | e-value | e-value | Condition | Condition FDR | Condition Difference |
|---|---|---|---|---|---|---|---|---|
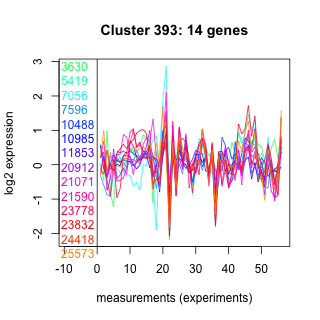
| Thaps_hclust_0393 |
 |
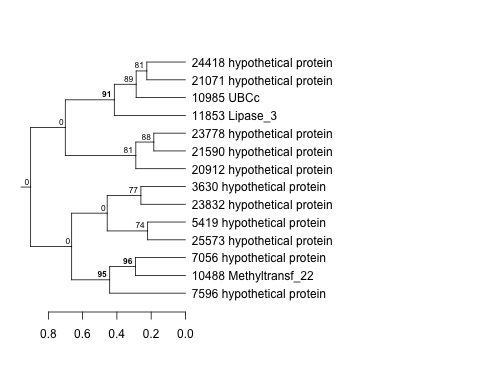 |
2 |
16 |
16 |
diel_light_vs_dark | 0.019500 | 0.549 |
| Thaps_hclust_0393 |
|
|
2 |
16 |
16 |
lowFe_KTKB_Day3 | 0.118000 | 0.435 |
| Thaps_hclust_0393 |
|
|
2 |
16 |
16 |
lowFe_KTKB_Day5 | 0.767000 | -0.0803 |
| Thaps_hclust_0393 |
|
|
2 |
16 |
16 |
BaP | 0.099300 | 0.414 |
| Thaps_hclust_0393 |
|
|
2 |
16 |
16 |
exponential_vs_stationary_24highlight | 0.374000 | -0.119 |
| Thaps_hclust_0393 |
|
|
2 |
16 |
16 |
co2_elevated_stat_arrays | 0.209000 | 0.319 |
| Thaps_hclust_0393 |
|
|
2 |
16 |
16 |
lowtemp_TMEVA | 0.825000 | -0.0751 |
| Thaps_hclust_0393 |
|
|
2 |
16 |
16 |
highpH_TMEVA | 0.664000 | 0.0938 |
| Thaps_hclust_0393 |
|
|
2 |
16 |
16 |
co2_elevated_expo_arrays | 0.911000 | -0.054 |
| Thaps_hclust_0393 |
|
|
2 |
16 |
16 |
lowFe_TMEVA | 0.776000 | 0.119 |
| Thaps_hclust_0393 |
|
|
2 |
16 |
16 |
exponential_vs_stationary_24light | 0.346000 | -0.354 |
| Thaps_hclust_0393 |
|
|
2 |
16 |
16 |
lowN_TMEVA | 0.608000 | -0.208 |
| Thaps_hclust_0393 |
|
|
2 |
16 |
16 |
diel_exponential_vs_stationary | 0.597000 | -0.127 |
| Thaps_hclust_0393 |
|
|
2 |
16 |
16 |
lowSi_TMEVA | 0.844000 | -0.218 |
| Thaps_hclust_0393 |
|
|
2 |
16 |
16 |
highlight_arrays | 0.027300 | 0.404 |
| Title | Cluster Plot | Dendrogram | e-value | e-value | e-value | Condition | Condition FDR | Condition Difference |
|---|---|---|---|---|---|---|---|---|
| Thaps_hclust_0003 |
 |
 |
0.24 |
16 |
240 |
co2_elevated_expo_arrays | 0.001390 | 0.419 |
| Thaps_hclust_0003 |
|
|
0.24 |
16 |
240 |
lowFe_TMEVA | 0.001040 | -0.814 |
| Thaps_hclust_0003 |
|
|
0.24 |
16 |
240 |
exponential_vs_stationary_24light | 0.348000 | -0.329 |
| Thaps_hclust_0003 |
|
|
0.24 |
16 |
240 |
lowN_TMEVA | 0.861000 | -0.0674 |
| Thaps_hclust_0003 |
|
|
0.24 |
16 |
240 |
diel_exponential_vs_stationary | 0.021500 | -0.434 |
| Thaps_hclust_0003 |
|
|
0.24 |
16 |
240 |
lowSi_TMEVA | 0.296000 | -0.538 |
| Thaps_hclust_0003 |
|
|
0.24 |
16 |
240 |
highlight_arrays | 0.001240 | 0.527 |
| Thaps_hclust_0003 |
|
|
0.24 |
16 |
240 |
diel_light_vs_dark | 0.030500 | -0.466 |
| Thaps_hclust_0003 |
|
|
0.24 |
16 |
240 |
lowFe_KTKB_Day3 | 0.000862 | -2.01 |
| Thaps_hclust_0003 |
|
|
0.24 |
16 |
240 |
lowFe_KTKB_Day5 | 0.004170 | -0.633 |
| Thaps_hclust_0003 |
|
|
0.24 |
16 |
240 |
BaP | 0.000370 | -1.68 |
| Thaps_hclust_0003 |
|
|
0.24 |
16 |
240 |
exponential_vs_stationary_24highlight | 0.042300 | -0.23 |
| Thaps_hclust_0003 |
|
|
0.24 |
16 |
240 |
co2_elevated_stat_arrays | 0.072800 | 0.415 |
| Thaps_hclust_0003 |
|
|
0.24 |
16 |
240 |
lowtemp_TMEVA | 0.016800 | -0.675 |
| Thaps_hclust_0003 |
|
|
0.24 |
16 |
240 |
highpH_TMEVA | 0.581000 | 0.103 |
| Title | Cluster Plot | Dendrogram | e-value | e-value | e-value | Condition | Condition FDR | Condition Difference |
|---|---|---|---|---|---|---|---|---|
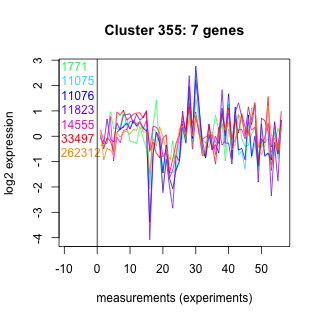
| Thaps_hclust_0355 |
 |
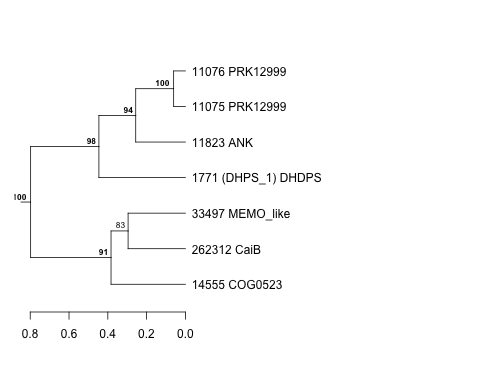 |
0.49 |
16 |
310 |
highlight_arrays | 0.099200 | 0.425 |
| Thaps_hclust_0355 |
|
|
0.49 |
16 |
310 |
diel_light_vs_dark | 0.176000 | -0.47 |
| Thaps_hclust_0355 |
|
|
0.49 |
16 |
310 |
lowFe_KTKB_Day3 | 0.000862 | -2.01 |
| Thaps_hclust_0355 |
|
|
0.49 |
16 |
310 |
lowFe_KTKB_Day5 | 0.783000 | -0.102 |
| Thaps_hclust_0355 |
|
|
0.49 |
16 |
310 |
BaP | 0.239000 | -0.432 |
| Thaps_hclust_0355 |
|
|
0.49 |
16 |
310 |
exponential_vs_stationary_24highlight | 0.002480 | -0.562 |
| Thaps_hclust_0355 |
|
|
0.49 |
16 |
310 |
co2_elevated_stat_arrays | 0.625000 | 0.168 |
| Thaps_hclust_0355 |
|
|
0.49 |
16 |
310 |
lowtemp_TMEVA | 0.278000 | -0.444 |
| Thaps_hclust_0355 |
|
|
0.49 |
16 |
310 |
highpH_TMEVA | 0.993000 | 0.00671 |
| Thaps_hclust_0355 |
|
|
0.49 |
16 |
310 |
co2_elevated_expo_arrays | 0.004880 | 0.605 |
| Thaps_hclust_0355 |
|
|
0.49 |
16 |
310 |
lowFe_TMEVA | 0.275000 | -0.462 |
| Thaps_hclust_0355 |
|
|
0.49 |
16 |
310 |
exponential_vs_stationary_24light | 0.075900 | -0.899 |
| Thaps_hclust_0355 |
|
|
0.49 |
16 |
310 |
lowN_TMEVA | 0.885000 | -0.0594 |
| Thaps_hclust_0355 |
|
|
0.49 |
16 |
310 |
diel_exponential_vs_stationary | 0.001600 | -1.05 |
| Thaps_hclust_0355 |
|
|
0.49 |
16 |
310 |
lowSi_TMEVA | 0.913000 | 0.181 |
| Title | Cluster Plot | Dendrogram | e-value | e-value | e-value | Condition | Condition FDR | Condition Difference |
|---|---|---|---|---|---|---|---|---|
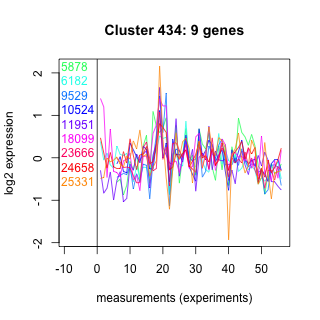
| Thaps_hclust_0434 |
 |
 |
0.011 |
17 |
57 |
co2_elevated_stat_arrays | 0.928000 | 0.0314 |
| Thaps_hclust_0434 |
|
|
0.011 |
17 |
57 |
lowtemp_TMEVA | 0.321000 | -0.365 |
| Thaps_hclust_0434 |
|
|
0.011 |
17 |
57 |
highpH_TMEVA | 0.183000 | 0.295 |
| Thaps_hclust_0434 |
|
|
0.011 |
17 |
57 |
co2_elevated_expo_arrays | 0.833000 | 0.0856 |
| Thaps_hclust_0434 |
|
|
0.011 |
17 |
57 |
lowFe_TMEVA | 0.996000 | -0.00697 |
| Thaps_hclust_0434 |
|
|
0.011 |
17 |
57 |
exponential_vs_stationary_24light | 0.869000 | -0.091 |
| Thaps_hclust_0434 |
|
|
0.011 |
17 |
57 |
lowN_TMEVA | 0.564000 | -0.263 |
| Thaps_hclust_0434 |
|
|
0.011 |
17 |
57 |
diel_exponential_vs_stationary | 0.857000 | -0.061 |
| Title | Cluster Plot | Dendrogram | e-value | e-value | e-value | Condition | Condition FDR | Condition Difference |
|---|---|---|---|---|---|---|---|---|
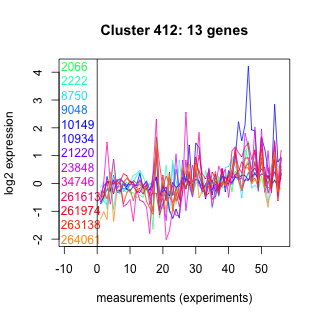
| Thaps_hclust_0412 |
 |
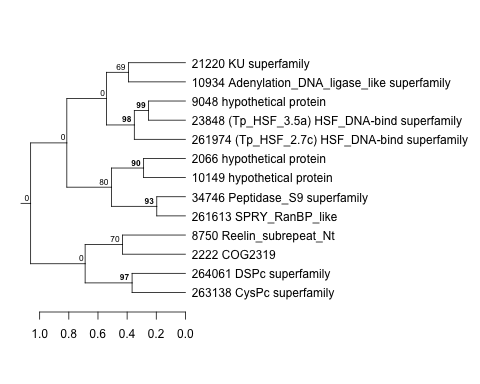 |
0.39 |
17 |
2.9 |
lowFe_KTKB_Day3 | 0.081500 | -0.505 |
| Thaps_hclust_0412 |
|
|
0.39 |
17 |
2.9 |
lowFe_KTKB_Day5 | 0.157000 | -0.359 |
| Thaps_hclust_0412 |
|
|
0.39 |
17 |
2.9 |
BaP | 0.656000 | -0.132 |
| Thaps_hclust_0412 |
|
|
0.39 |
17 |
2.9 |
exponential_vs_stationary_24highlight | 0.122000 | -0.204 |
| Thaps_hclust_0412 |
|
|
0.39 |
17 |
2.9 |
co2_elevated_stat_arrays | 0.037800 | -0.531 |
| Thaps_hclust_0412 |
|
|
0.39 |
17 |
2.9 |
lowtemp_TMEVA | 0.799000 | -0.0909 |
| Thaps_hclust_0412 |
|
|
0.39 |
17 |
2.9 |
highpH_TMEVA | 0.003570 | -0.577 |
| Thaps_hclust_0412 |
|
|
0.39 |
17 |
2.9 |
co2_elevated_expo_arrays | 0.802000 | -0.0911 |
| Title | Cluster Plot | Dendrogram | e-value | e-value | e-value | Condition | Condition FDR | Condition Difference |
|---|---|---|---|---|---|---|---|---|
| Thaps_hclust_0491 |
 |
 |
0.35 |
17 |
52 |
lowFe_TMEVA | 0.300000 | -0.356 |
| Thaps_hclust_0491 |
|
|
0.35 |
17 |
52 |
exponential_vs_stationary_24light | 0.989000 | -0.0046 |
| Thaps_hclust_0491 |
|
|
0.35 |
17 |
52 |
lowN_TMEVA | 0.607000 | 0.22 |
| Thaps_hclust_0491 |
|
|
0.35 |
17 |
52 |
diel_exponential_vs_stationary | 0.031400 | 0.496 |
| Thaps_hclust_0491 |
|
|
0.35 |
17 |
52 |
lowSi_TMEVA | 0.997000 | -0.0912 |
| Thaps_hclust_0491 |
|
|
0.35 |
17 |
52 |
highlight_arrays | 0.000847 | 0.699 |
| Title | Cluster Plot | Dendrogram | e-value | e-value | e-value | Condition | Condition FDR | Condition Difference |
|---|---|---|---|---|---|---|---|---|
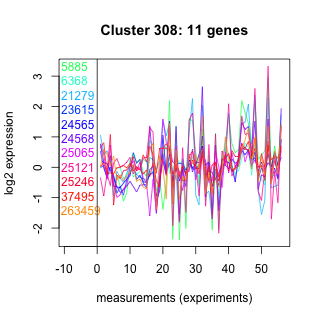
| Thaps_hclust_0308 |
 |
 |
0.37 |
17 |
1.6 |
BaP | 0.703000 | -0.124 |
| Thaps_hclust_0308 |
|
|
0.37 |
17 |
1.6 |
exponential_vs_stationary_24highlight | 0.006110 | -0.416 |
| Thaps_hclust_0308 |
|
|
0.37 |
17 |
1.6 |
co2_elevated_stat_arrays | 0.000658 | 0.927 |
| Thaps_hclust_0308 |
|
|
0.37 |
17 |
1.6 |
lowtemp_TMEVA | 0.243000 | -0.403 |
| Thaps_hclust_0308 |
|
|
0.37 |
17 |
1.6 |
highpH_TMEVA | 0.072300 | 0.375 |
| Thaps_hclust_0308 |
|
|
0.37 |
17 |
1.6 |
co2_elevated_expo_arrays | 0.802000 | -0.0941 |
| Thaps_hclust_0308 |
|
|
0.37 |
17 |
1.6 |
lowFe_TMEVA | 0.622000 | 0.185 |
| Title | Cluster Plot | Dendrogram | e-value | e-value | e-value | Condition | Condition FDR | Condition Difference |
|---|---|---|---|---|---|---|---|---|
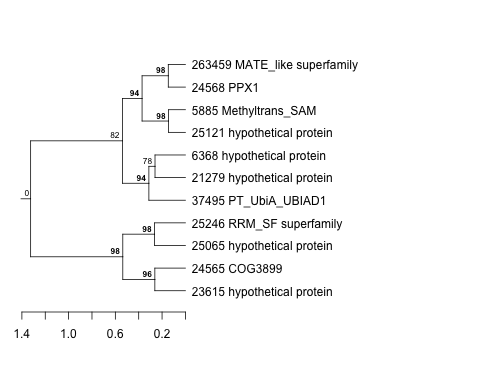
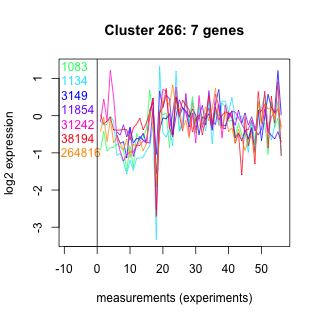
| Thaps_hclust_0266 |
 |
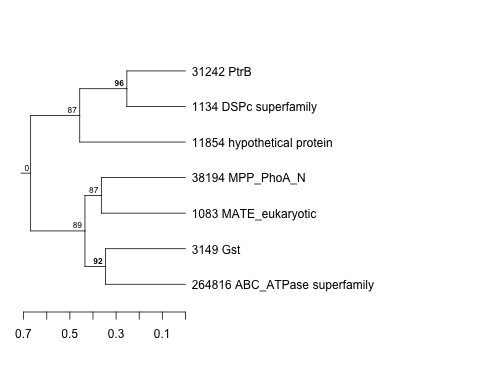 |
0.44 |
17 |
30 |
lowSi_TMEVA | 1.000000 | 0.0413 |
| Thaps_hclust_0266 |
|
|
0.44 |
17 |
30 |
highlight_arrays | 0.208000 | -0.33 |
| Thaps_hclust_0266 |
|
|
0.44 |
17 |
30 |
diel_light_vs_dark | 0.991000 | 0.00476 |
| Thaps_hclust_0266 |
|
|
0.44 |
17 |
30 |
lowFe_KTKB_Day3 | 0.863000 | -0.0809 |
| Thaps_hclust_0266 |
|
|
0.44 |
17 |
30 |
lowFe_KTKB_Day5 | 0.724000 | 0.127 |
| Thaps_hclust_0266 |
|
|
0.44 |
17 |
30 |
BaP | 0.311000 | -0.373 |