Hierarchical Clusters
Displaying 7001 - 7100 of 7500
| Title | Cluster Plot | Dendrogram | e-value | e-value | e-value | Condition | Condition FDR | Condition Difference |
|---|---|---|---|---|---|---|---|---|
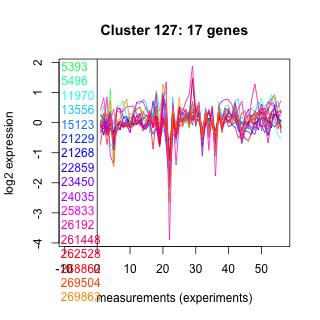
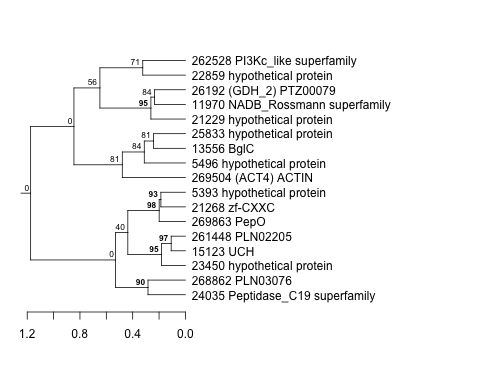
| Thaps_hclust_0127 |
 |
 |
2.6 |
32 |
48 |
lowSi_TMEVA | 1.000000 | 0.0642 |
| Thaps_hclust_0127 |
|
|
2.6 |
32 |
48 |
highlight_arrays | 0.428000 | -0.145 |
| Thaps_hclust_0127 |
|
|
2.6 |
32 |
48 |
diel_light_vs_dark | 0.003750 | 0.592 |
| Title | Cluster Plot | Dendrogram | e-value | e-value | e-value | Condition | Condition FDR | Condition Difference |
|---|---|---|---|---|---|---|---|---|
| Thaps_hclust_0109 |
 |
 |
17 |
32 |
5.5 |
lowSi_TMEVA | 1.000000 | -0.0551 |
| Thaps_hclust_0109 |
|
|
17 |
32 |
5.5 |
highlight_arrays | 0.315000 | 0.207 |
| Title | Cluster Plot | Dendrogram | e-value | e-value | e-value | Condition | Condition FDR | Condition Difference |
|---|---|---|---|---|---|---|---|---|
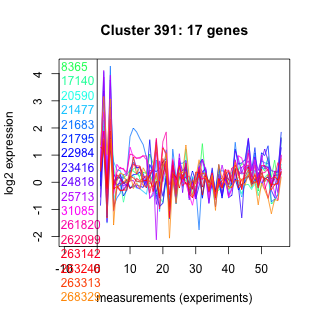
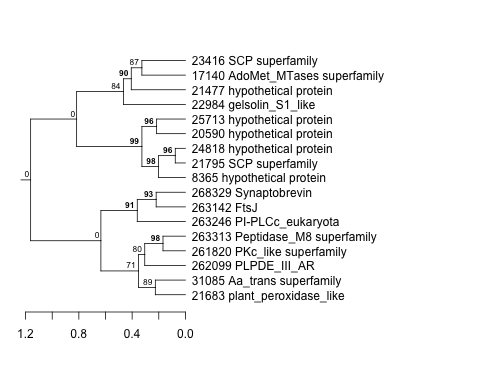
| Thaps_hclust_0391 |
 |
 |
1.9 |
34 |
32 |
exponential_vs_stationary_24light | 0.230000 | -0.406 |
| Thaps_hclust_0391 |
|
|
1.9 |
34 |
32 |
lowN_TMEVA | 0.113000 | -0.546 |
| Thaps_hclust_0391 |
|
|
1.9 |
34 |
32 |
diel_exponential_vs_stationary | 0.797000 | -0.0601 |
| Thaps_hclust_0391 |
|
|
1.9 |
34 |
32 |
lowSi_TMEVA | 0.001350 | 2.41 |
| Thaps_hclust_0391 |
|
|
1.9 |
34 |
32 |
highlight_arrays | 0.650000 | 0.0883 |
| Thaps_hclust_0391 |
|
|
1.9 |
34 |
32 |
diel_light_vs_dark | 0.018500 | 0.494 |
| Thaps_hclust_0391 |
|
|
1.9 |
34 |
32 |
lowFe_KTKB_Day3 | 0.375000 | 0.24 |
| Thaps_hclust_0391 |
|
|
1.9 |
34 |
32 |
lowFe_KTKB_Day5 | 0.475000 | 0.166 |
| Thaps_hclust_0391 |
|
|
1.9 |
34 |
32 |
BaP | 0.227000 | 0.292 |
| Thaps_hclust_0391 |
|
|
1.9 |
34 |
32 |
exponential_vs_stationary_24highlight | 0.005770 | -0.321 |
| Thaps_hclust_0391 |
|
|
1.9 |
34 |
32 |
co2_elevated_stat_arrays | 0.953000 | -0.0141 |
| Thaps_hclust_0391 |
|
|
1.9 |
34 |
32 |
lowtemp_TMEVA | 0.263000 | -0.314 |
| Thaps_hclust_0391 |
|
|
1.9 |
34 |
32 |
highpH_TMEVA | 0.124000 | 0.262 |
| Thaps_hclust_0391 |
|
|
1.9 |
34 |
32 |
co2_elevated_expo_arrays | 0.563000 | 0.132 |
| Thaps_hclust_0391 |
|
|
1.9 |
34 |
32 |
lowFe_TMEVA | 0.001040 | 2.32 |
| Title | Cluster Plot | Dendrogram | e-value | e-value | e-value | Condition | Condition FDR | Condition Difference |
|---|---|---|---|---|---|---|---|---|
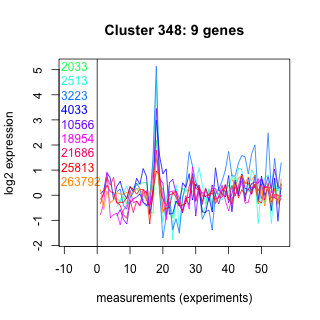
| Thaps_hclust_0348 |
 |
 |
8.7 |
34 |
60 |
BaP | 0.042300 | 0.635 |
| Thaps_hclust_0348 |
|
|
8.7 |
34 |
60 |
exponential_vs_stationary_24highlight | 0.166000 | -0.219 |
| Thaps_hclust_0348 |
|
|
8.7 |
34 |
60 |
co2_elevated_stat_arrays | 0.468000 | 0.225 |
| Thaps_hclust_0348 |
|
|
8.7 |
34 |
60 |
lowtemp_TMEVA | 0.884000 | -0.0656 |
| Thaps_hclust_0348 |
|
|
8.7 |
34 |
60 |
highpH_TMEVA | 0.376000 | -0.201 |
| Thaps_hclust_0348 |
|
|
8.7 |
34 |
60 |
co2_elevated_expo_arrays | 0.443000 | 0.197 |
| Thaps_hclust_0348 |
|
|
8.7 |
34 |
60 |
lowFe_TMEVA | 0.836000 | -0.0996 |
| Thaps_hclust_0348 |
|
|
8.7 |
34 |
60 |
exponential_vs_stationary_24light | 0.180000 | -0.584 |
| Thaps_hclust_0348 |
|
|
8.7 |
34 |
60 |
lowN_TMEVA | 0.179000 | 0.618 |
| Thaps_hclust_0348 |
|
|
8.7 |
34 |
60 |
diel_exponential_vs_stationary | 0.094900 | -0.448 |
| Thaps_hclust_0348 |
|
|
8.7 |
34 |
60 |
lowSi_TMEVA | 1.000000 | 0.00471 |
| Thaps_hclust_0348 |
|
|
8.7 |
34 |
60 |
highlight_arrays | 0.239000 | 0.278 |
| Thaps_hclust_0348 |
|
|
8.7 |
34 |
60 |
diel_light_vs_dark | 0.952000 | -0.0376 |
| Thaps_hclust_0348 |
|
|
8.7 |
34 |
60 |
lowFe_KTKB_Day3 | 0.200000 | -0.447 |
| Thaps_hclust_0348 |
|
|
8.7 |
34 |
60 |
lowFe_KTKB_Day5 | 0.146000 | 0.437 |
| Title | Cluster Plot | Dendrogram | e-value | e-value | e-value | Condition | Condition FDR | Condition Difference |
|---|---|---|---|---|---|---|---|---|
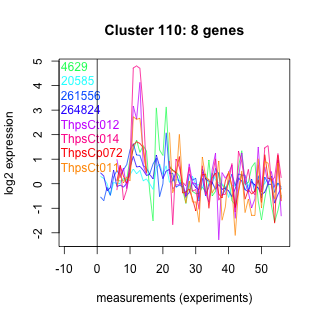
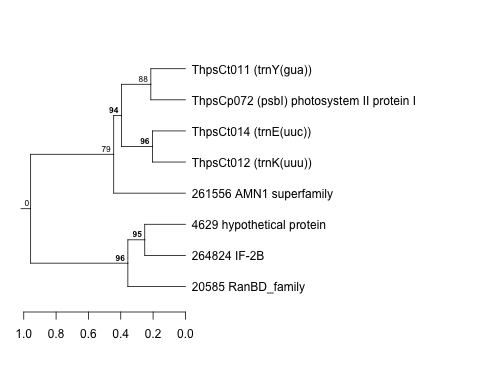
| Thaps_hclust_0110 |
 |
 |
0.64 |
35 |
160 |
lowFe_KTKB_Day3 | 0.795000 | 0.11 |
| Thaps_hclust_0110 |
|
|
0.64 |
35 |
160 |
lowFe_KTKB_Day5 | 0.581000 | -0.183 |
| Thaps_hclust_0110 |
|
|
0.64 |
35 |
160 |
BaP | 0.004310 | 1.03 |
| Thaps_hclust_0110 |
|
|
0.64 |
35 |
160 |
exponential_vs_stationary_24highlight | 0.457000 | 0.13 |
| Thaps_hclust_0110 |
|
|
0.64 |
35 |
160 |
co2_elevated_stat_arrays | 0.039400 | 0.636 |
| Thaps_hclust_0110 |
|
|
0.64 |
35 |
160 |
lowtemp_TMEVA | 0.445000 | 0.292 |
| Thaps_hclust_0110 |
|
|
0.64 |
35 |
160 |
highpH_TMEVA | 0.799000 | 0.0738 |
| Thaps_hclust_0110 |
|
|
0.64 |
35 |
160 |
co2_elevated_expo_arrays | 0.600000 | 0.155 |
| Thaps_hclust_0110 |
|
|
0.64 |
35 |
160 |
lowFe_TMEVA | 0.911000 | -0.0521 |
| Thaps_hclust_0110 |
|
|
0.64 |
35 |
160 |
exponential_vs_stationary_24light | 0.178000 | 0.624 |
| Thaps_hclust_0110 |
|
|
0.64 |
35 |
160 |
lowN_TMEVA | 0.761000 | -0.143 |
| Thaps_hclust_0110 |
|
|
0.64 |
35 |
160 |
diel_exponential_vs_stationary | 0.125000 | 0.438 |
| Thaps_hclust_0110 |
|
|
0.64 |
35 |
160 |
lowSi_TMEVA | 0.643000 | -0.369 |
| Thaps_hclust_0110 |
|
|
0.64 |
35 |
160 |
highlight_arrays | 0.761000 | -0.0853 |
| Thaps_hclust_0110 |
|
|
0.64 |
35 |
160 |
diel_light_vs_dark | 0.491000 | -0.251 |
| Title | Cluster Plot | Dendrogram | e-value | e-value | e-value | Condition | Condition FDR | Condition Difference |
|---|---|---|---|---|---|---|---|---|
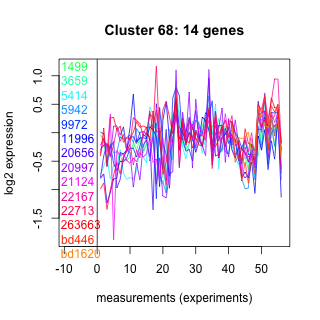
| Thaps_hclust_0068 |
 |
 |
0.34 |
36 |
100 |
lowN_TMEVA | 0.130000 | -0.567 |
| Thaps_hclust_0068 |
|
|
0.34 |
36 |
100 |
diel_exponential_vs_stationary | 0.663000 | 0.109 |
| Thaps_hclust_0068 |
|
|
0.34 |
36 |
100 |
lowSi_TMEVA | 0.590000 | -0.377 |
| Thaps_hclust_0068 |
|
|
0.34 |
36 |
100 |
highlight_arrays | 0.018200 | -0.442 |
| Thaps_hclust_0068 |
|
|
0.34 |
36 |
100 |
diel_light_vs_dark | 0.557000 | -0.172 |
| Thaps_hclust_0068 |
|
|
0.34 |
36 |
100 |
lowFe_KTKB_Day3 | 0.978000 | -0.00927 |
| Thaps_hclust_0068 |
|
|
0.34 |
36 |
100 |
lowFe_KTKB_Day5 | 0.849000 | -0.0516 |
| Thaps_hclust_0068 |
|
|
0.34 |
36 |
100 |
BaP | 0.191000 | -0.335 |
| Thaps_hclust_0068 |
|
|
0.34 |
36 |
100 |
exponential_vs_stationary_24highlight | 0.080000 | 0.218 |
| Thaps_hclust_0068 |
|
|
0.34 |
36 |
100 |
co2_elevated_stat_arrays | 0.235000 | -0.304 |
| Thaps_hclust_0068 |
|
|
0.34 |
36 |
100 |
lowtemp_TMEVA | 0.110000 | -0.489 |
| Thaps_hclust_0068 |
|
|
0.34 |
36 |
100 |
highpH_TMEVA | 0.015400 | -0.461 |
| Thaps_hclust_0068 |
|
|
0.34 |
36 |
100 |
co2_elevated_expo_arrays | 0.985000 | -0.00972 |
| Thaps_hclust_0068 |
|
|
0.34 |
36 |
100 |
lowFe_TMEVA | 0.318000 | -0.313 |
| Thaps_hclust_0068 |
|
|
0.34 |
36 |
100 |
exponential_vs_stationary_24light | 0.238000 | 0.427 |
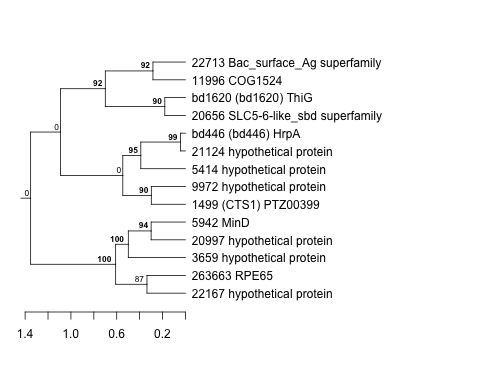
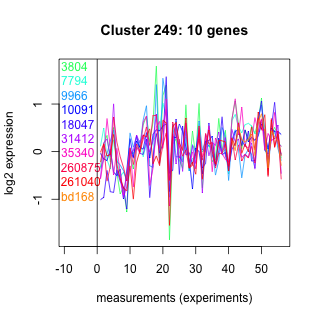
| Title | Cluster Plot | Dendrogram | e-value | e-value | e-value | Condition | Condition FDR | Condition Difference |
|---|---|---|---|---|---|---|---|---|
| Thaps_hclust_0249 |
 |
 |
14 |
39 |
180 |
lowFe_TMEVA | 0.960000 | -0.0288 |
| Thaps_hclust_0249 |
|
|
14 |
39 |
180 |
exponential_vs_stationary_24light | 0.704000 | 0.186 |
| Thaps_hclust_0249 |
|
|
14 |
39 |
180 |
lowN_TMEVA | 0.963000 | -0.0225 |
| Thaps_hclust_0249 |
|
|
14 |
39 |
180 |
diel_exponential_vs_stationary | 0.752000 | -0.0932 |
| Thaps_hclust_0249 |
|
|
14 |
39 |
180 |
lowSi_TMEVA | 0.929000 | -0.171 |
| Thaps_hclust_0249 |
|
|
14 |
39 |
180 |
highlight_arrays | 0.780000 | -0.0721 |
| Thaps_hclust_0249 |
|
|
14 |
39 |
180 |
diel_light_vs_dark | 0.278000 | 0.33 |
| Thaps_hclust_0249 |
|
|
14 |
39 |
180 |
lowFe_KTKB_Day3 | 0.688000 | -0.153 |
| Thaps_hclust_0249 |
|
|
14 |
39 |
180 |
lowFe_KTKB_Day5 | 0.652000 | 0.132 |
| Thaps_hclust_0249 |
|
|
14 |
39 |
180 |
BaP | 0.050600 | 0.586 |
| Thaps_hclust_0249 |
|
|
14 |
39 |
180 |
exponential_vs_stationary_24highlight | 0.456000 | 0.116 |
| Thaps_hclust_0249 |
|
|
14 |
39 |
180 |
co2_elevated_stat_arrays | 0.098900 | -0.471 |
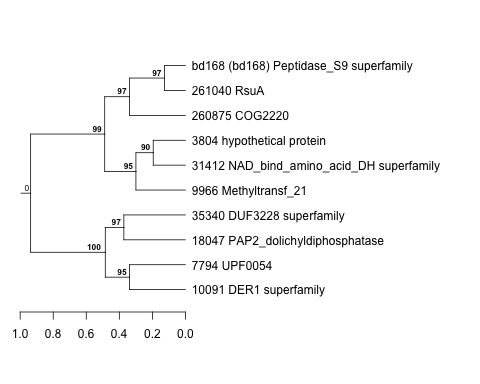
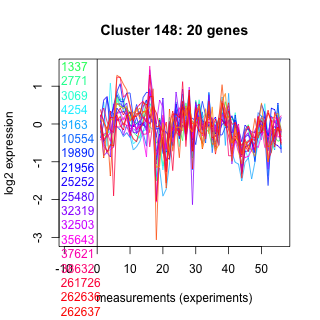
| Title | Cluster Plot | Dendrogram | e-value | e-value | e-value | Condition | Condition FDR | Condition Difference |
|---|---|---|---|---|---|---|---|---|
| Thaps_hclust_0148 |
 |
 |
4.7 |
39 |
51 |
exponential_vs_stationary_24highlight | 0.452000 | 0.0871 |
| Thaps_hclust_0148 |
|
|
4.7 |
39 |
51 |
co2_elevated_stat_arrays | 0.059800 | -0.409 |
| Thaps_hclust_0148 |
|
|
4.7 |
39 |
51 |
lowtemp_TMEVA | 0.640000 | -0.129 |
| Thaps_hclust_0148 |
|
|
4.7 |
39 |
51 |
highpH_TMEVA | 0.984000 | 0.00668 |
| Thaps_hclust_0148 |
|
|
4.7 |
39 |
51 |
co2_elevated_expo_arrays | 0.873000 | 0.0629 |
| Thaps_hclust_0148 |
|
|
4.7 |
39 |
51 |
lowFe_TMEVA | 0.549000 | -0.182 |
| Thaps_hclust_0148 |
|
|
4.7 |
39 |
51 |
exponential_vs_stationary_24light | 0.597000 | 0.194 |
| Thaps_hclust_0148 |
|
|
4.7 |
39 |
51 |
lowN_TMEVA | 0.505000 | -0.241 |
| Thaps_hclust_0148 |
|
|
4.7 |
39 |
51 |
diel_exponential_vs_stationary | 0.533000 | -0.126 |
| Thaps_hclust_0148 |
|
|
4.7 |
39 |
51 |
lowSi_TMEVA | 0.854000 | -0.205 |
| Thaps_hclust_0148 |
|
|
4.7 |
39 |
51 |
highlight_arrays | 0.047900 | -0.304 |
| Title | Cluster Plot | Dendrogram | e-value | e-value | e-value | Condition | Condition FDR | Condition Difference |
|---|---|---|---|---|---|---|---|---|
| Thaps_hclust_0276 |
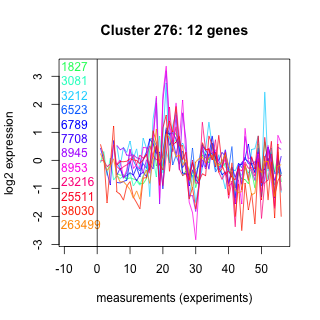 |
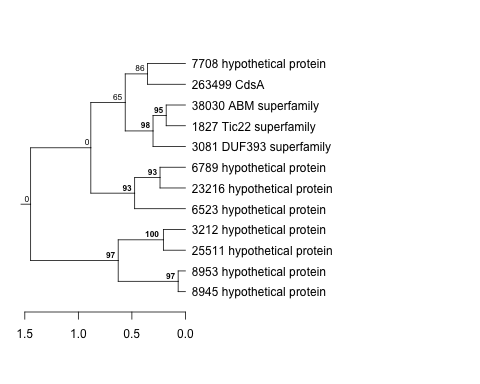 |
0.063 |
39 |
53 |
lowFe_KTKB_Day5 | 0.045800 | 0.538 |
| Thaps_hclust_0276 |
|
|
0.063 |
39 |
53 |
BaP | 0.042100 | 0.562 |
| Thaps_hclust_0276 |
|
|
0.063 |
39 |
53 |
exponential_vs_stationary_24highlight | 0.000526 | 0.486 |
| Thaps_hclust_0276 |
|
|
0.063 |
39 |
53 |
co2_elevated_stat_arrays | 0.126000 | 0.408 |
| Thaps_hclust_0276 |
|
|
0.063 |
39 |
53 |
lowtemp_TMEVA | 0.265000 | 0.366 |
| Thaps_hclust_0276 |
|
|
0.063 |
39 |
53 |
highpH_TMEVA | 0.253000 | 0.231 |
| Thaps_hclust_0276 |
|
|
0.063 |
39 |
53 |
co2_elevated_expo_arrays | 0.802000 | -0.0902 |
| Thaps_hclust_0276 |
|
|
0.063 |
39 |
53 |
lowFe_TMEVA | 0.853000 | 0.0864 |
| Thaps_hclust_0276 |
|
|
0.063 |
39 |
53 |
exponential_vs_stationary_24light | 0.044000 | 0.777 |
| Thaps_hclust_0276 |
|
|
0.063 |
39 |
53 |
lowN_TMEVA | 0.128000 | -0.616 |
| Thaps_hclust_0276 |
|
|
0.063 |
39 |
53 |
diel_exponential_vs_stationary | 0.000602 | 0.877 |
| Thaps_hclust_0276 |
|
|
0.063 |
39 |
53 |
lowSi_TMEVA | 0.806000 | -0.263 |