Thaps_bicluster_0120 Residual: 0.39
Thalassiosira pseudonana
| Title | Residual | Model version | Organism |
|---|---|---|---|
| Thaps_bicluster_0120 | 0.39 | Thalassiosira pseudonana |
" class="views-fluidgrid-wrapper clear-block">
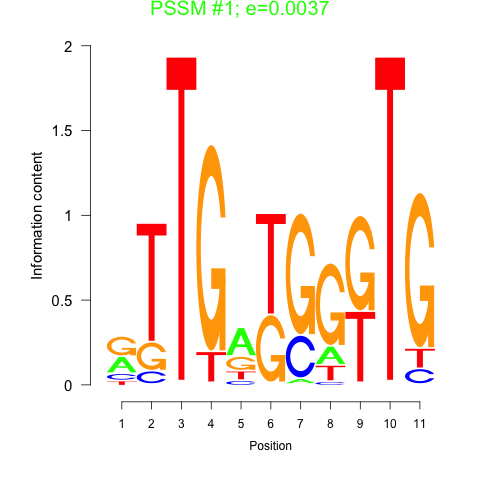
Motif 1 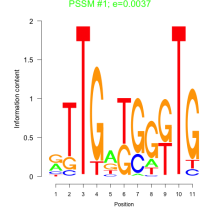
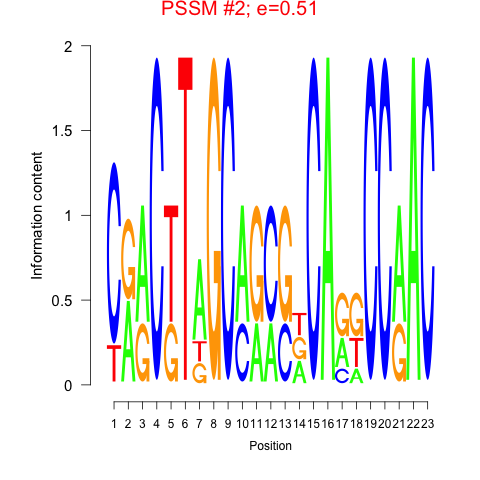
Motif 2 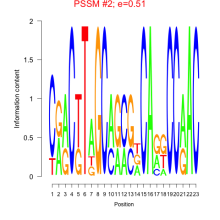
Displaying 1 - 22 of 22
" class="views-fluidgrid-wrapper clear-block">
21155 hypothetical protein
22822 NTF2
25662 hypothetical protein
261766 PGP_euk
263770 hypothetical protein
268187 (ycf19_1) COG0762
268668 HAD_like
31402 DUF3007 superfamily
31951 MMT1
32145 PLN02579
3341 hypothetical protein
33780 UBQ superfamily
36879 BolA
40788 NADB_Rossmann superfamily
4331 Aldolase_Class_I superfamily
5601 hypothetical protein
6173 hypothetical protein
6383 PTZ00162
7611 hypothetical protein
8954 hypothetical protein
9490 hypothetical protein
968 RimI
| GO ID | Go Term | p-value | q-value | Cluster |
|---|---|---|---|---|
| GO:0006606 | protein-nucleus import | 0.00557274 | 1 | Thaps_bicluster_0120 |
| GO:0000105 | histidine biosynthesis | 0.0147993 | 1 | Thaps_bicluster_0120 |
| GO:0006636 | fatty acid desaturation | 0.0221257 | 1 | Thaps_bicluster_0120 |
| GO:0006350 | transcription | 0.0544987 | 1 | Thaps_bicluster_0120 |
| GO:0006812 | cation transport | 0.0772831 | 1 | Thaps_bicluster_0120 |
| GO:0006464 | protein modification | 0.104655 | 1 | Thaps_bicluster_0120 |
| GO:0005975 | carbohydrate metabolism | 0.131302 | 1 | Thaps_bicluster_0120 |
| GO:0006508 | proteolysis and peptidolysis | 0.424754 | 1 | Thaps_bicluster_0120 |
| GO:0008152 | metabolism | 0.546944 | 1 | Thaps_bicluster_0120 |
Comments