Thaps_hclust_0131 Hierarchical Clustering
Thalassiosira pseudonana
| Cluster Plot | Conditions Plot | Dendrogram |
|---|---|---|
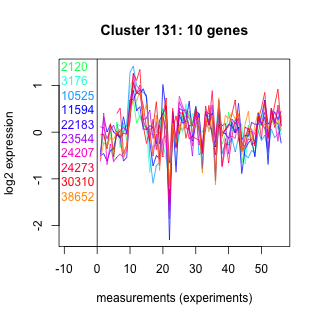 |
 |
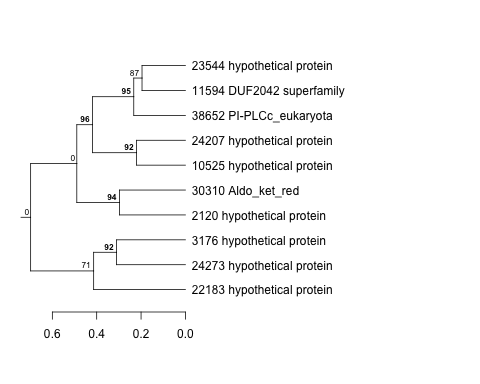 |
| GO ID | Go Term | p-value | q-value | Cluster |
|---|---|---|---|---|
| GO:0007160 | cell-matrix adhesion | 0.0184762 | 1 | Thaps_hclust_0131 |
| GO:0006629 | lipid metabolism | 0.0296321 | 1 | Thaps_hclust_0131 |
| GO:0007155 | cell adhesion | 0.0306412 | 1 | Thaps_hclust_0131 |
| GO:0007165 | signal transduction | 0.0406863 | 1 | Thaps_hclust_0131 |
| GO:0007242 | intracellular signaling cascade | 0.0426852 | 1 | Thaps_hclust_0131 |
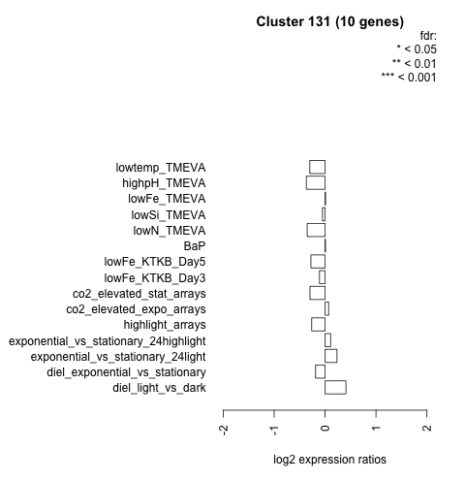
| Condition | Condition | Difference | FDR |
|---|---|---|---|
| diel_light_vs_dark | diel_light_vs_dark | 0.411 | 0.154 |
| lowFe_KTKB_Day3 | lowFe_KTKB_Day3 | -0.110 | 0.779 |
| lowFe_KTKB_Day5 | lowFe_KTKB_Day5 | -0.278 | 0.337 |
| BaP | BaP | 0.008 | 0.991 |
| exponential_vs_stationary_24highlight | exponential_vs_stationary_24highlight | 0.110 | 0.484 |
| co2_elevated_stat_arrays | co2_elevated_stat_arrays | -0.297 | 0.299 |
| lowtemp_TMEVA | lowtemp_TMEVA | -0.300 | 0.394 |
| highpH_TMEVA | highpH_TMEVA | -0.367 | 0.096 |
| co2_elevated_expo_arrays | co2_elevated_expo_arrays | 0.072 | 0.873 |
| lowFe_TMEVA | lowFe_TMEVA | 0.010 | 0.995 |
| exponential_vs_stationary_24light | exponential_vs_stationary_24light | 0.234 | 0.615 |
| lowN_TMEVA | lowN_TMEVA | -0.351 | 0.411 |
| diel_exponential_vs_stationary | diel_exponential_vs_stationary | -0.187 | 0.484 |
| lowSi_TMEVA | lowSi_TMEVA | -0.051 | 1 |
| highlight_arrays | highlight_arrays | -0.263 | 0.236 |