Thaps_hclust_0161 Hierarchical Clustering
Thalassiosira pseudonana
| Cluster Plot | Conditions Plot | Dendrogram |
|---|---|---|
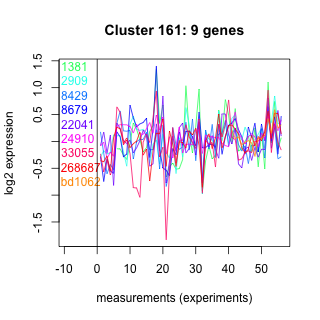 |
 |
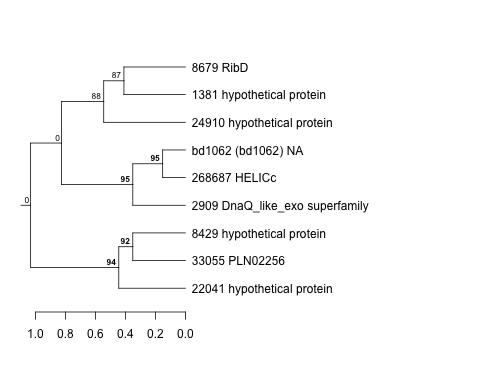 |
| GO ID | Go Term | p-value | q-value | Cluster |
|---|---|---|---|---|
| GO:0006979 | response to oxidative stress | 0.00496175 | 1 | Thaps_hclust_0161 |
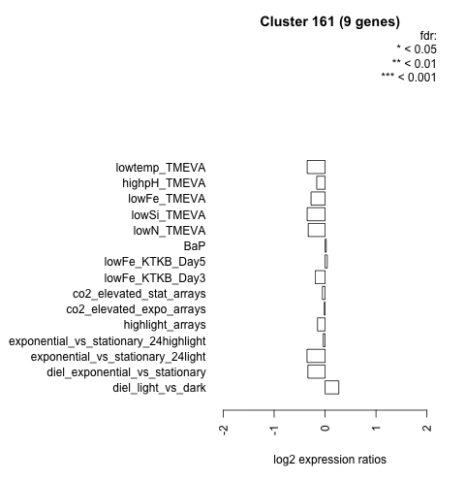
| Condition | Condition | Difference | FDR |
|---|---|---|---|
| diel_light_vs_dark | diel_light_vs_dark | 0.270 | 0.426 |
| lowFe_KTKB_Day3 | lowFe_KTKB_Day3 | -0.193 | 0.604 |
| lowFe_KTKB_Day5 | lowFe_KTKB_Day5 | 0.043 | 0.902 |
| BaP | BaP | 0.023 | 0.954 |
| exponential_vs_stationary_24highlight | exponential_vs_stationary_24highlight | -0.036 | 0.847 |
| co2_elevated_stat_arrays | co2_elevated_stat_arrays | -0.052 | 0.884 |
| lowtemp_TMEVA | lowtemp_TMEVA | -0.350 | 0.339 |
| highpH_TMEVA | highpH_TMEVA | -0.164 | 0.481 |
| co2_elevated_expo_arrays | co2_elevated_expo_arrays | -0.016 | 0.985 |
| lowFe_TMEVA | lowFe_TMEVA | -0.275 | 0.438 |
| exponential_vs_stationary_24light | exponential_vs_stationary_24light | -0.354 | 0.449 |
| lowN_TMEVA | lowN_TMEVA | -0.330 | 0.469 |
| diel_exponential_vs_stationary | diel_exponential_vs_stationary | -0.337 | 0.207 |
| lowSi_TMEVA | lowSi_TMEVA | -0.351 | 0.663 |
| highlight_arrays | highlight_arrays | -0.149 | 0.544 |