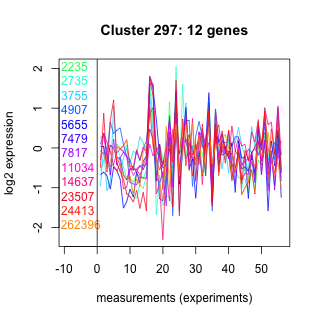
Thaps_hclust_0297 Hierarchical Clustering
Thalassiosira pseudonana
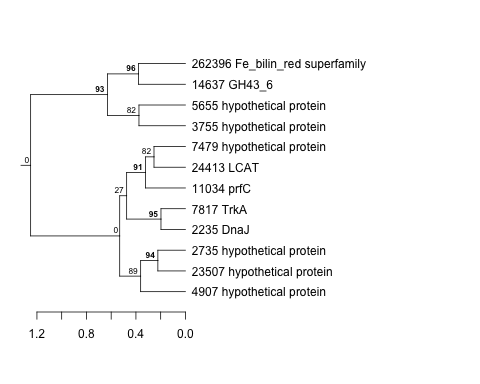
| Cluster Plot | Conditions Plot | Dendrogram |
|---|---|---|
 |
 |
 |
| GO ID | Go Term | p-value | q-value | Cluster |
|---|---|---|---|---|
| GO:0010024 | phytochromobilin biosynthesis | 0.00206654 | 1 | Thaps_hclust_0297 |
| GO:0006415 | translational termination | 0.00618938 | 1 | Thaps_hclust_0297 |
| GO:0006629 | lipid metabolism | 0.0296321 | 1 | Thaps_hclust_0297 |
| GO:0006457 | protein folding | 0.127399 | 1 | Thaps_hclust_0297 |
| GO:0006412 | protein biosynthesis | 0.160275 | 1 | Thaps_hclust_0297 |
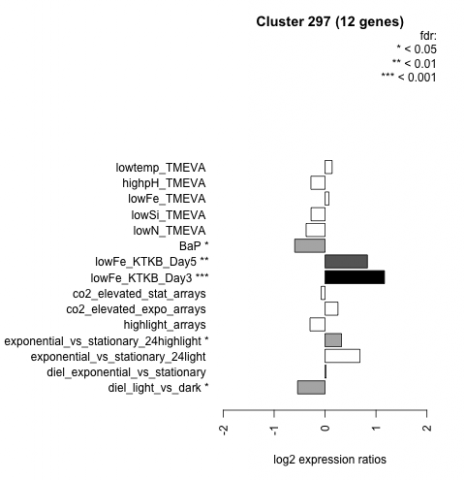
| Condition | Condition | Difference | FDR |
|---|---|---|---|
| diel_light_vs_dark | diel_light_vs_dark | -0.539 | 0.0335 |
| lowFe_KTKB_Day3 | lowFe_KTKB_Day3 | 1.170 | 0.000862 |
| lowFe_KTKB_Day5 | lowFe_KTKB_Day5 | 0.832 | 0.00341 |
| BaP | BaP | -0.595 | 0.0321 |
| exponential_vs_stationary_24highlight | exponential_vs_stationary_24highlight | 0.323 | 0.022 |
| co2_elevated_stat_arrays | co2_elevated_stat_arrays | -0.076 | 0.807 |
| lowtemp_TMEVA | lowtemp_TMEVA | 0.138 | 0.695 |
| highpH_TMEVA | highpH_TMEVA | -0.278 | 0.165 |
| co2_elevated_expo_arrays | co2_elevated_expo_arrays | 0.253 | 0.178 |
| lowFe_TMEVA | lowFe_TMEVA | 0.076 | 0.857 |
| exponential_vs_stationary_24light | exponential_vs_stationary_24light | 0.685 | 0.072 |
| lowN_TMEVA | lowN_TMEVA | -0.372 | 0.36 |
| diel_exponential_vs_stationary | diel_exponential_vs_stationary | 0.018 | 0.96 |
| lowSi_TMEVA | lowSi_TMEVA | -0.274 | 0.788 |
| highlight_arrays | highlight_arrays | -0.295 | 0.133 |