Hierarchical Clusters
Displaying 1001 - 1100 of 7500
| Title | Cluster Plot | Dendrogram | e-value | e-value | e-value | Condition | Condition FDR | Condition Difference |
|---|---|---|---|---|---|---|---|---|
| Thaps_hclust_0434 |
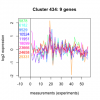 |
 |
0.011 |
17 |
57 |
lowSi_TMEVA | 1.000000 | 0.0404 |
| Thaps_hclust_0434 |
 |
 |
0.011 |
17 |
57 |
highlight_arrays | 0.129000 | 0.354 |
| Thaps_hclust_0434 |
 |
 |
0.011 |
17 |
57 |
diel_light_vs_dark | 0.562000 | 0.209 |
| Thaps_hclust_0434 |
 |
 |
0.011 |
17 |
57 |
lowFe_KTKB_Day3 | 0.224000 | -0.422 |
| Thaps_hclust_0434 |
 |
 |
0.011 |
17 |
57 |
lowFe_KTKB_Day5 | 0.787000 | 0.0874 |
| Title | Cluster Plot | Dendrogram | e-value | e-value | e-value | Condition | Condition FDR | Condition Difference |
|---|---|---|---|---|---|---|---|---|
| Thaps_hclust_0433 |
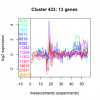 |
 |
14 |
54 |
440 |
lowFe_KTKB_Day5 | 0.017400 | -0.591 |
| Thaps_hclust_0433 |
 |
 |
14 |
54 |
440 |
BaP | 0.051800 | 0.495 |
| Thaps_hclust_0433 |
 |
 |
14 |
54 |
440 |
exponential_vs_stationary_24highlight | 0.061500 | -0.244 |
| Thaps_hclust_0433 |
 |
 |
14 |
54 |
440 |
co2_elevated_stat_arrays | 0.111000 | 0.408 |
| Thaps_hclust_0433 |
 |
 |
14 |
54 |
440 |
lowtemp_TMEVA | 0.455000 | -0.232 |
| Thaps_hclust_0433 |
 |
 |
14 |
54 |
440 |
highpH_TMEVA | 0.049400 | -0.386 |
| Thaps_hclust_0433 |
 |
 |
14 |
54 |
440 |
co2_elevated_expo_arrays | 0.934000 | 0.044 |
| Thaps_hclust_0433 |
 |
 |
14 |
54 |
440 |
lowFe_TMEVA | 0.257000 | -0.361 |
| Thaps_hclust_0433 |
 |
 |
14 |
54 |
440 |
exponential_vs_stationary_24light | 0.604000 | -0.226 |
| Thaps_hclust_0433 |
 |
 |
14 |
54 |
440 |
lowN_TMEVA | 0.661000 | -0.188 |
| Thaps_hclust_0433 |
 |
 |
14 |
54 |
440 |
diel_exponential_vs_stationary | 0.559000 | 0.146 |
| Thaps_hclust_0433 |
 |
 |
14 |
54 |
440 |
lowSi_TMEVA | 1.000000 | -0.0409 |
| Thaps_hclust_0433 |
 |
 |
14 |
54 |
440 |
highlight_arrays | 0.108000 | 0.312 |
| Thaps_hclust_0433 |
 |
 |
14 |
54 |
440 |
diel_light_vs_dark | 0.686000 | -0.13 |
| Thaps_hclust_0433 |
 |
 |
14 |
54 |
440 |
lowFe_KTKB_Day3 | 0.000862 | -1.11 |
| Title | Cluster Plot | Dendrogram | e-value | e-value | e-value | Condition | Condition FDR | Condition Difference |
|---|---|---|---|---|---|---|---|---|
| Thaps_hclust_0432 |
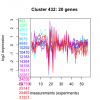 |
 |
0.011 |
0.06 |
2.4 |
lowFe_KTKB_Day5 | 0.138000 | -0.299 |
| Thaps_hclust_0432 |
 |
 |
0.011 |
0.06 |
2.4 |
BaP | 0.930000 | 0.0255 |
| Thaps_hclust_0432 |
 |
 |
0.011 |
0.06 |
2.4 |
exponential_vs_stationary_24highlight | 0.634000 | 0.0568 |
| Thaps_hclust_0432 |
 |
 |
0.011 |
0.06 |
2.4 |
co2_elevated_stat_arrays | 0.381000 | -0.211 |
| Thaps_hclust_0432 |
 |
 |
0.011 |
0.06 |
2.4 |
lowtemp_TMEVA | 0.706000 | -0.105 |
| Thaps_hclust_0432 |
 |
 |
0.011 |
0.06 |
2.4 |
highpH_TMEVA | 0.725000 | -0.069 |
| Thaps_hclust_0432 |
 |
 |
0.011 |
0.06 |
2.4 |
co2_elevated_expo_arrays | 0.985000 | 0.0127 |
| Thaps_hclust_0432 |
 |
 |
0.011 |
0.06 |
2.4 |
lowFe_TMEVA | 0.625000 | -0.157 |
| Thaps_hclust_0432 |
 |
 |
0.011 |
0.06 |
2.4 |
exponential_vs_stationary_24light | 0.151000 | 0.45 |
| Thaps_hclust_0432 |
 |
 |
0.011 |
0.06 |
2.4 |
lowN_TMEVA | 0.411000 | -0.287 |
| Thaps_hclust_0432 |
 |
 |
0.011 |
0.06 |
2.4 |
diel_exponential_vs_stationary | 0.999000 | -0.000697 |
| Thaps_hclust_0432 |
 |
 |
0.011 |
0.06 |
2.4 |
lowSi_TMEVA | 0.832000 | -0.23 |
| Thaps_hclust_0432 |
 |
 |
0.011 |
0.06 |
2.4 |
highlight_arrays | 0.548000 | -0.105 |
| Thaps_hclust_0432 |
 |
 |
0.011 |
0.06 |
2.4 |
diel_light_vs_dark | 0.000485 | 0.797 |
| Thaps_hclust_0432 |
 |
 |
0.011 |
0.06 |
2.4 |
lowFe_KTKB_Day3 | 0.023300 | -0.505 |
| Title | Cluster Plot | Dendrogram | e-value | e-value | e-value | Condition | Condition FDR | Condition Difference |
|---|---|---|---|---|---|---|---|---|
| Thaps_hclust_0431 |
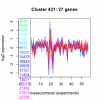 |
 |
0.003 |
0.00095 |
0.0043 |
lowFe_KTKB_Day3 | 0.706000 | -0.0915 |
| Thaps_hclust_0431 |
 |
 |
0.003 |
0.00095 |
0.0043 |
lowFe_KTKB_Day5 | 0.724000 | 0.0702 |
| Thaps_hclust_0431 |
 |
 |
0.003 |
0.00095 |
0.0043 |
BaP | 0.855000 | -0.0432 |
| Thaps_hclust_0431 |
 |
 |
0.003 |
0.00095 |
0.0043 |
exponential_vs_stationary_24highlight | 0.081700 | -0.155 |
| Thaps_hclust_0431 |
 |
 |
0.003 |
0.00095 |
0.0043 |
co2_elevated_stat_arrays | 0.101000 | -0.321 |
| Thaps_hclust_0431 |
 |
 |
0.003 |
0.00095 |
0.0043 |
lowtemp_TMEVA | 0.297000 | -0.229 |
| Thaps_hclust_0431 |
 |
 |
0.003 |
0.00095 |
0.0043 |
highpH_TMEVA | 0.021800 | 0.313 |
| Thaps_hclust_0431 |
 |
 |
0.003 |
0.00095 |
0.0043 |
co2_elevated_expo_arrays | 0.985000 | -0.013 |
| Thaps_hclust_0431 |
 |
 |
0.003 |
0.00095 |
0.0043 |
lowFe_TMEVA | 0.414000 | -0.212 |
| Thaps_hclust_0431 |
 |
 |
0.003 |
0.00095 |
0.0043 |
exponential_vs_stationary_24light | 0.179000 | -0.372 |
| Thaps_hclust_0431 |
 |
 |
0.003 |
0.00095 |
0.0043 |
lowN_TMEVA | 0.695000 | 0.143 |
| Thaps_hclust_0431 |
 |
 |
0.003 |
0.00095 |
0.0043 |
diel_exponential_vs_stationary | 0.007320 | -0.395 |
| Thaps_hclust_0431 |
 |
 |
0.003 |
0.00095 |
0.0043 |
lowSi_TMEVA | 0.345000 | -0.431 |
| Thaps_hclust_0431 |
 |
 |
0.003 |
0.00095 |
0.0043 |
highlight_arrays | 0.016800 | 0.324 |
| Thaps_hclust_0431 |
 |
 |
0.003 |
0.00095 |
0.0043 |
diel_light_vs_dark | 0.171000 | 0.243 |
| Title | Cluster Plot | Dendrogram | e-value | e-value | e-value | Condition | Condition FDR | Condition Difference |
|---|---|---|---|---|---|---|---|---|
| Thaps_hclust_0430 |
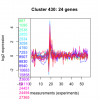 |
 |
0.0000088 |
0.0043 |
0.22 |
diel_light_vs_dark | 0.306000 | 0.205 |
| Thaps_hclust_0430 |
 |
 |
0.0000088 |
0.0043 |
0.22 |
lowFe_KTKB_Day3 | 0.996000 | -0.00183 |
| Thaps_hclust_0430 |
 |
 |
0.0000088 |
0.0043 |
0.22 |
lowFe_KTKB_Day5 | 0.260000 | 0.211 |
| Thaps_hclust_0430 |
 |
 |
0.0000088 |
0.0043 |
0.22 |
BaP | 0.002200 | 0.6 |
| Thaps_hclust_0430 |
 |
 |
0.0000088 |
0.0043 |
0.22 |
exponential_vs_stationary_24highlight | 0.249000 | -0.115 |
| Thaps_hclust_0430 |
 |
 |
0.0000088 |
0.0043 |
0.22 |
co2_elevated_stat_arrays | 0.953000 | -0.0146 |
| Thaps_hclust_0430 |
 |
 |
0.0000088 |
0.0043 |
0.22 |
lowtemp_TMEVA | 0.263000 | 0.268 |
| Thaps_hclust_0430 |
 |
 |
0.0000088 |
0.0043 |
0.22 |
highpH_TMEVA | 1.000000 | -0.00175 |
| Thaps_hclust_0430 |
 |
 |
0.0000088 |
0.0043 |
0.22 |
co2_elevated_expo_arrays | 0.971000 | 0.0223 |
| Thaps_hclust_0430 |
 |
 |
0.0000088 |
0.0043 |
0.22 |
lowFe_TMEVA | 0.975000 | -0.0192 |
| Thaps_hclust_0430 |
 |
 |
0.0000088 |
0.0043 |
0.22 |
exponential_vs_stationary_24light | 0.521000 | -0.213 |
| Thaps_hclust_0430 |
 |
 |
0.0000088 |
0.0043 |
0.22 |
lowN_TMEVA | 0.995000 | -0.00696 |
| Thaps_hclust_0430 |
 |
 |
0.0000088 |
0.0043 |
0.22 |
diel_exponential_vs_stationary | 0.693000 | -0.0801 |
| Thaps_hclust_0430 |
 |
 |
0.0000088 |
0.0043 |
0.22 |
lowSi_TMEVA | 0.321000 | -0.467 |
| Thaps_hclust_0430 |
 |
 |
0.0000088 |
0.0043 |
0.22 |
highlight_arrays | 0.833000 | 0.0359 |
| Title | Cluster Plot | Dendrogram | e-value | e-value | e-value | Condition | Condition FDR | Condition Difference |
|---|---|---|---|---|---|---|---|---|
| Thaps_hclust_0429 |
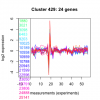 |
 |
0.0000000033 |
0.00000039 |
0.000054 |
diel_light_vs_dark | 0.235000 | 0.231 |
| Thaps_hclust_0429 |
 |
 |
0.0000000033 |
0.00000039 |
0.000054 |
lowFe_KTKB_Day3 | 0.810000 | -0.0596 |
| Thaps_hclust_0429 |
 |
 |
0.0000000033 |
0.00000039 |
0.000054 |
lowFe_KTKB_Day5 | 0.246000 | 0.217 |
| Thaps_hclust_0429 |
 |
 |
0.0000000033 |
0.00000039 |
0.000054 |
BaP | 0.773000 | 0.0672 |
| Thaps_hclust_0429 |
 |
 |
0.0000000033 |
0.00000039 |
0.000054 |
exponential_vs_stationary_24highlight | 0.961000 | -0.00769 |
| Thaps_hclust_0429 |
 |
 |
0.0000000033 |
0.00000039 |
0.000054 |
co2_elevated_stat_arrays | 0.694000 | -0.108 |
| Thaps_hclust_0429 |
 |
 |
0.0000000033 |
0.00000039 |
0.000054 |
lowtemp_TMEVA | 0.898000 | -0.0385 |
| Thaps_hclust_0429 |
 |
 |
0.0000000033 |
0.00000039 |
0.000054 |
highpH_TMEVA | 0.722000 | -0.0638 |
| Thaps_hclust_0429 |
 |
 |
0.0000000033 |
0.00000039 |
0.000054 |
co2_elevated_expo_arrays | 0.430000 | 0.144 |
| Thaps_hclust_0429 |
 |
 |
0.0000000033 |
0.00000039 |
0.000054 |
lowFe_TMEVA | 0.888000 | 0.0538 |
| Thaps_hclust_0429 |
 |
 |
0.0000000033 |
0.00000039 |
0.000054 |
exponential_vs_stationary_24light | 0.631000 | 0.165 |
| Thaps_hclust_0429 |
 |
 |
0.0000000033 |
0.00000039 |
0.000054 |
lowN_TMEVA | 0.360000 | -0.294 |
| Thaps_hclust_0429 |
 |
 |
0.0000000033 |
0.00000039 |
0.000054 |
diel_exponential_vs_stationary | 0.469000 | 0.132 |
| Thaps_hclust_0429 |
 |
 |
0.0000000033 |
0.00000039 |
0.000054 |
lowSi_TMEVA | 0.599000 | -0.335 |
| Thaps_hclust_0429 |
 |
 |
0.0000000033 |
0.00000039 |
0.000054 |
highlight_arrays | 0.745000 | -0.0557 |
| Title | Cluster Plot | Dendrogram | e-value | e-value | e-value | Condition | Condition FDR | Condition Difference |
|---|---|---|---|---|---|---|---|---|
| Thaps_hclust_0428 |
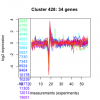 |
 |
0.000000076 |
0.015 |
1.9 |
highlight_arrays | 0.948000 | 0.01 |
| Thaps_hclust_0428 |
 |
 |
0.000000076 |
0.015 |
1.9 |
diel_light_vs_dark | 0.993000 | -0.00165 |
| Thaps_hclust_0428 |
 |
 |
0.000000076 |
0.015 |
1.9 |
lowFe_KTKB_Day3 | 0.795000 | -0.0578 |
| Thaps_hclust_0428 |
 |
 |
0.000000076 |
0.015 |
1.9 |
lowFe_KTKB_Day5 | 0.453000 | -0.124 |
| Thaps_hclust_0428 |
 |
 |
0.000000076 |
0.015 |
1.9 |
BaP | 0.109000 | -0.258 |
| Thaps_hclust_0428 |
 |
 |
0.000000076 |
0.015 |
1.9 |
exponential_vs_stationary_24highlight | 0.584000 | -0.051 |
| Thaps_hclust_0428 |
 |
 |
0.000000076 |
0.015 |
1.9 |
co2_elevated_stat_arrays | 0.928000 | 0.0269 |
| Thaps_hclust_0428 |
 |
 |
0.000000076 |
0.015 |
1.9 |
lowtemp_TMEVA | 0.849000 | 0.0459 |
| Thaps_hclust_0428 |
 |
 |
0.000000076 |
0.015 |
1.9 |
highpH_TMEVA | 0.118000 | -0.197 |
| Thaps_hclust_0428 |
 |
 |
0.000000076 |
0.015 |
1.9 |
co2_elevated_expo_arrays | 0.830000 | 0.0703 |
| Thaps_hclust_0428 |
 |
 |
0.000000076 |
0.015 |
1.9 |
lowFe_TMEVA | 0.216000 | -0.285 |
| Thaps_hclust_0428 |
 |
 |
0.000000076 |
0.015 |
1.9 |
exponential_vs_stationary_24light | 0.833000 | -0.0741 |
| Thaps_hclust_0428 |
 |
 |
0.000000076 |
0.015 |
1.9 |
lowN_TMEVA | 0.670000 | -0.153 |
| Thaps_hclust_0428 |
 |
 |
0.000000076 |
0.015 |
1.9 |
diel_exponential_vs_stationary | 0.262000 | 0.158 |
| Thaps_hclust_0428 |
 |
 |
0.000000076 |
0.015 |
1.9 |
lowSi_TMEVA | 0.983000 | -0.124 |
| Title | Cluster Plot | Dendrogram | e-value | e-value | e-value | Condition | Condition FDR | Condition Difference |
|---|---|---|---|---|---|---|---|---|
| Thaps_hclust_0427 |
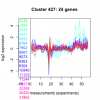 |
 |
0.0000022 |
8.8 |
40 |
lowSi_TMEVA | 1.000000 | 0.0889 |
| Thaps_hclust_0427 |
 |
 |
0.0000022 |
8.8 |
40 |
highlight_arrays | 0.405000 | 0.129 |
| Thaps_hclust_0427 |
 |
 |
0.0000022 |
8.8 |
40 |
diel_light_vs_dark | 0.686000 | -0.0991 |
| Thaps_hclust_0427 |
 |
 |
0.0000022 |
8.8 |
40 |
lowFe_KTKB_Day3 | 0.926000 | -0.0273 |
| Thaps_hclust_0427 |
 |
 |
0.0000022 |
8.8 |
40 |
lowFe_KTKB_Day5 | 0.754000 | -0.0647 |
