Hierarchical Clusters
Displaying 3501 - 3600 of 7500
| Title | Cluster Plot | Dendrogram | e-value | e-value | e-value | Condition | Condition FDR | Condition Difference |
|---|---|---|---|---|---|---|---|---|
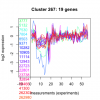
| Thaps_hclust_0267 |
 |
 |
0.00000003 |
0.39 |
0.58 |
co2_elevated_stat_arrays | 0.706000 | 0.103 |
| Thaps_hclust_0267 |
 |
 |
0.00000003 |
0.39 |
0.58 |
lowtemp_TMEVA | 0.361000 | 0.244 |
| Thaps_hclust_0267 |
 |
 |
0.00000003 |
0.39 |
0.58 |
highpH_TMEVA | 0.901000 | -0.0307 |
| Thaps_hclust_0267 |
 |
 |
0.00000003 |
0.39 |
0.58 |
co2_elevated_expo_arrays | 0.985000 | 0.0131 |
| Thaps_hclust_0267 |
 |
 |
0.00000003 |
0.39 |
0.58 |
lowFe_TMEVA | 0.996000 | 0.00375 |
| Thaps_hclust_0267 |
 |
 |
0.00000003 |
0.39 |
0.58 |
exponential_vs_stationary_24light | 0.823000 | -0.0914 |
| Thaps_hclust_0267 |
 |
 |
0.00000003 |
0.39 |
0.58 |
lowN_TMEVA | 0.670000 | 0.165 |
| Thaps_hclust_0267 |
 |
 |
0.00000003 |
0.39 |
0.58 |
diel_exponential_vs_stationary | 0.649000 | 0.0974 |
| Thaps_hclust_0267 |
 |
 |
0.00000003 |
0.39 |
0.58 |
lowSi_TMEVA | 0.989000 | 0.1 |
| Thaps_hclust_0267 |
 |
 |
0.00000003 |
0.39 |
0.58 |
highlight_arrays | 0.190000 | -0.212 |
| Title | Cluster Plot | Dendrogram | e-value | e-value | e-value | Condition | Condition FDR | Condition Difference |
|---|---|---|---|---|---|---|---|---|
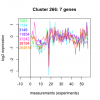
| Thaps_hclust_0266 |
 |
 |
0.44 |
17 |
30 |
highlight_arrays | 0.208000 | -0.33 |
| Thaps_hclust_0266 |
 |
 |
0.44 |
17 |
30 |
diel_light_vs_dark | 0.991000 | 0.00476 |
| Thaps_hclust_0266 |
 |
 |
0.44 |
17 |
30 |
lowFe_KTKB_Day3 | 0.863000 | -0.0809 |
| Thaps_hclust_0266 |
 |
 |
0.44 |
17 |
30 |
lowFe_KTKB_Day5 | 0.724000 | 0.127 |
| Thaps_hclust_0266 |
 |
 |
0.44 |
17 |
30 |
BaP | 0.311000 | -0.373 |
| Thaps_hclust_0266 |
 |
 |
0.44 |
17 |
30 |
exponential_vs_stationary_24highlight | 0.026000 | 0.404 |
| Thaps_hclust_0266 |
 |
 |
0.44 |
17 |
30 |
co2_elevated_stat_arrays | 0.503000 | -0.222 |
| Thaps_hclust_0266 |
 |
 |
0.44 |
17 |
30 |
lowtemp_TMEVA | 0.430000 | -0.32 |
| Thaps_hclust_0266 |
 |
 |
0.44 |
17 |
30 |
highpH_TMEVA | 0.186000 | -0.331 |
| Thaps_hclust_0266 |
 |
 |
0.44 |
17 |
30 |
co2_elevated_expo_arrays | 0.873000 | 0.0807 |
| Thaps_hclust_0266 |
 |
 |
0.44 |
17 |
30 |
lowFe_TMEVA | 0.853000 | -0.0957 |
| Thaps_hclust_0266 |
 |
 |
0.44 |
17 |
30 |
exponential_vs_stationary_24light | 0.294000 | 0.519 |
| Thaps_hclust_0266 |
 |
 |
0.44 |
17 |
30 |
lowN_TMEVA | 0.362000 | -0.431 |
| Thaps_hclust_0266 |
 |
 |
0.44 |
17 |
30 |
diel_exponential_vs_stationary | 0.956000 | 0.0233 |
| Thaps_hclust_0266 |
 |
 |
0.44 |
17 |
30 |
lowSi_TMEVA | 1.000000 | 0.0413 |
| Title | Cluster Plot | Dendrogram | e-value | e-value | e-value | Condition | Condition FDR | Condition Difference |
|---|---|---|---|---|---|---|---|---|
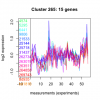
| Thaps_hclust_0265 |
 |
 |
0.02 |
0.000051 |
27 |
lowSi_TMEVA | 1.000000 | 0.0466 |
| Thaps_hclust_0265 |
 |
 |
0.02 |
0.000051 |
27 |
highlight_arrays | 0.001570 | -0.558 |
| Thaps_hclust_0265 |
 |
 |
0.02 |
0.000051 |
27 |
diel_light_vs_dark | 0.915000 | 0.0418 |
| Thaps_hclust_0265 |
 |
 |
0.02 |
0.000051 |
27 |
lowFe_KTKB_Day3 | 0.276000 | -0.302 |
| Thaps_hclust_0265 |
 |
 |
0.02 |
0.000051 |
27 |
lowFe_KTKB_Day5 | 0.284000 | -0.254 |
| Thaps_hclust_0265 |
 |
 |
0.02 |
0.000051 |
27 |
BaP | 0.566000 | 0.155 |
| Thaps_hclust_0265 |
 |
 |
0.02 |
0.000051 |
27 |
exponential_vs_stationary_24highlight | 0.386000 | 0.111 |
| Thaps_hclust_0265 |
 |
 |
0.02 |
0.000051 |
27 |
co2_elevated_stat_arrays | 0.468000 | -0.192 |
| Thaps_hclust_0265 |
 |
 |
0.02 |
0.000051 |
27 |
lowtemp_TMEVA | 0.787000 | 0.0895 |
| Thaps_hclust_0265 |
 |
 |
0.02 |
0.000051 |
27 |
highpH_TMEVA | 0.059900 | -0.334 |
| Thaps_hclust_0265 |
 |
 |
0.02 |
0.000051 |
27 |
co2_elevated_expo_arrays | 0.601000 | 0.127 |
| Thaps_hclust_0265 |
 |
 |
0.02 |
0.000051 |
27 |
lowFe_TMEVA | 0.888000 | 0.0586 |
| Thaps_hclust_0265 |
 |
 |
0.02 |
0.000051 |
27 |
exponential_vs_stationary_24light | 0.491000 | 0.266 |
| Thaps_hclust_0265 |
 |
 |
0.02 |
0.000051 |
27 |
lowN_TMEVA | 0.594000 | -0.213 |
| Thaps_hclust_0265 |
 |
 |
0.02 |
0.000051 |
27 |
diel_exponential_vs_stationary | 0.981000 | 0.00675 |
| Title | Cluster Plot | Dendrogram | e-value | e-value | e-value | Condition | Condition FDR | Condition Difference |
|---|---|---|---|---|---|---|---|---|
| Thaps_hclust_0264 |
 |
 |
0.0079 |
0.24 |
5.8 |
diel_exponential_vs_stationary | 0.837000 | 0.059 |
| Thaps_hclust_0264 |
 |
 |
0.0079 |
0.24 |
5.8 |
lowSi_TMEVA | 0.722000 | 0.301 |
| Thaps_hclust_0264 |
 |
 |
0.0079 |
0.24 |
5.8 |
highlight_arrays | 0.042100 | -0.397 |
| Thaps_hclust_0264 |
 |
 |
0.0079 |
0.24 |
5.8 |
diel_light_vs_dark | 0.521000 | 0.188 |
| Thaps_hclust_0264 |
 |
 |
0.0079 |
0.24 |
5.8 |
lowFe_KTKB_Day3 | 0.177000 | -0.393 |
| Thaps_hclust_0264 |
 |
 |
0.0079 |
0.24 |
5.8 |
lowFe_KTKB_Day5 | 0.090100 | -0.432 |
| Thaps_hclust_0264 |
 |
 |
0.0079 |
0.24 |
5.8 |
BaP | 0.477000 | -0.201 |
| Thaps_hclust_0264 |
 |
 |
0.0079 |
0.24 |
5.8 |
exponential_vs_stationary_24highlight | 0.967000 | 0.00789 |
| Thaps_hclust_0264 |
 |
 |
0.0079 |
0.24 |
5.8 |
co2_elevated_stat_arrays | 0.123000 | -0.396 |
| Thaps_hclust_0264 |
 |
 |
0.0079 |
0.24 |
5.8 |
lowtemp_TMEVA | 0.380000 | 0.277 |
| Thaps_hclust_0264 |
 |
 |
0.0079 |
0.24 |
5.8 |
highpH_TMEVA | 0.799000 | -0.062 |
| Thaps_hclust_0264 |
 |
 |
0.0079 |
0.24 |
5.8 |
co2_elevated_expo_arrays | 0.969000 | -0.0246 |
| Thaps_hclust_0264 |
 |
 |
0.0079 |
0.24 |
5.8 |
lowFe_TMEVA | 0.899000 | -0.0549 |
| Thaps_hclust_0264 |
 |
 |
0.0079 |
0.24 |
5.8 |
exponential_vs_stationary_24light | 0.990000 | 0.00347 |
| Thaps_hclust_0264 |
 |
 |
0.0079 |
0.24 |
5.8 |
lowN_TMEVA | 0.861000 | -0.0733 |
| Title | Cluster Plot | Dendrogram | e-value | e-value | e-value | Condition | Condition FDR | Condition Difference |
|---|---|---|---|---|---|---|---|---|
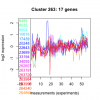
| Thaps_hclust_0263 |
 |
 |
0.15 |
0.25 |
1.4 |
lowN_TMEVA | 0.072700 | -0.616 |
| Thaps_hclust_0263 |
 |
 |
0.15 |
0.25 |
1.4 |
diel_exponential_vs_stationary | 0.363000 | -0.191 |
| Thaps_hclust_0263 |
 |
 |
0.15 |
0.25 |
1.4 |
lowSi_TMEVA | 0.557000 | -0.386 |
| Thaps_hclust_0263 |
 |
 |
0.15 |
0.25 |
1.4 |
highlight_arrays | 0.027600 | -0.378 |
| Thaps_hclust_0263 |
 |
 |
0.15 |
0.25 |
1.4 |
diel_light_vs_dark | 0.470000 | 0.184 |
| Thaps_hclust_0263 |
 |
 |
0.15 |
0.25 |
1.4 |
lowFe_KTKB_Day3 | 0.978000 | 0.00883 |
| Thaps_hclust_0263 |
 |
 |
0.15 |
0.25 |
1.4 |
lowFe_KTKB_Day5 | 0.477000 | 0.162 |
| Thaps_hclust_0263 |
 |
 |
0.15 |
0.25 |
1.4 |
BaP | 0.710000 | -0.101 |
| Thaps_hclust_0263 |
 |
 |
0.15 |
0.25 |
1.4 |
exponential_vs_stationary_24highlight | 0.890000 | 0.0208 |
| Thaps_hclust_0263 |
 |
 |
0.15 |
0.25 |
1.4 |
co2_elevated_stat_arrays | 0.941000 | 0.0223 |
| Thaps_hclust_0263 |
 |
 |
0.15 |
0.25 |
1.4 |
lowtemp_TMEVA | 0.045600 | -0.557 |
| Thaps_hclust_0263 |
 |
 |
0.15 |
0.25 |
1.4 |
highpH_TMEVA | 0.002530 | -0.575 |
| Thaps_hclust_0263 |
 |
 |
0.15 |
0.25 |
1.4 |
co2_elevated_expo_arrays | 0.748000 | 0.0949 |
| Thaps_hclust_0263 |
 |
 |
0.15 |
0.25 |
1.4 |
lowFe_TMEVA | 0.427000 | -0.239 |
| Thaps_hclust_0263 |
 |
 |
0.15 |
0.25 |
1.4 |
exponential_vs_stationary_24light | 0.823000 | 0.0944 |
| Title | Cluster Plot | Dendrogram | e-value | e-value | e-value | Condition | Condition FDR | Condition Difference |
|---|---|---|---|---|---|---|---|---|
| Thaps_hclust_0262 |
 |
 |
12 |
130 |
130 |
exponential_vs_stationary_24light | 0.682000 | -0.213 |
| Thaps_hclust_0262 |
 |
 |
12 |
130 |
130 |
lowN_TMEVA | 0.789000 | 0.123 |
| Thaps_hclust_0262 |
 |
 |
12 |
130 |
130 |
diel_exponential_vs_stationary | 0.533000 | -0.179 |
| Thaps_hclust_0262 |
 |
 |
12 |
130 |
130 |
lowSi_TMEVA | 0.707000 | -0.328 |
| Thaps_hclust_0262 |
 |
 |
12 |
130 |
130 |
highlight_arrays | 0.462000 | -0.18 |
| Thaps_hclust_0262 |
 |
 |
12 |
130 |
130 |
diel_light_vs_dark | 0.919000 | 0.0497 |
| Thaps_hclust_0262 |
 |
 |
12 |
130 |
130 |
lowFe_KTKB_Day3 | 0.527000 | -0.24 |
| Thaps_hclust_0262 |
 |
 |
12 |
130 |
130 |
lowFe_KTKB_Day5 | 1.000000 | -0.00176 |
| Thaps_hclust_0262 |
 |
 |
12 |
130 |
130 |
BaP | 0.656000 | -0.158 |
| Thaps_hclust_0262 |
 |
 |
12 |
130 |
130 |
exponential_vs_stationary_24highlight | 0.274000 | -0.173 |
| Thaps_hclust_0262 |
 |
 |
12 |
130 |
130 |
co2_elevated_stat_arrays | 0.697000 | -0.127 |
| Thaps_hclust_0262 |
 |
 |
12 |
130 |
130 |
lowtemp_TMEVA | 0.294000 | 0.39 |
| Thaps_hclust_0262 |
 |
 |
12 |
130 |
130 |
highpH_TMEVA | 0.358000 | -0.208 |
| Thaps_hclust_0262 |
 |
 |
12 |
130 |
130 |
co2_elevated_expo_arrays | 0.985000 | -0.0121 |
| Thaps_hclust_0262 |
 |
 |
12 |
130 |
130 |
lowFe_TMEVA | 0.482000 | -0.254 |
| Title | Cluster Plot | Dendrogram | e-value | e-value | e-value | Condition | Condition FDR | Condition Difference |
|---|---|---|---|---|---|---|---|---|
| Thaps_hclust_0261 |
 |
 |
0.00000000025 |
0.000000005 |
0.0000069 |
lowFe_TMEVA | 0.249000 | -0.272 |
| Thaps_hclust_0261 |
 |
 |
0.00000000025 |
0.000000005 |
0.0000069 |
exponential_vs_stationary_24light | 0.813000 | -0.0832 |
| Thaps_hclust_0261 |
 |
 |
0.00000000025 |
0.000000005 |
0.0000069 |
lowN_TMEVA | 0.808000 | 0.0873 |
| Thaps_hclust_0261 |
 |
 |
0.00000000025 |
0.000000005 |
0.0000069 |
diel_exponential_vs_stationary | 0.775000 | 0.0529 |
| Thaps_hclust_0261 |
 |
 |
0.00000000025 |
0.000000005 |
0.0000069 |
lowSi_TMEVA | 0.976000 | -0.127 |
| Thaps_hclust_0261 |
 |
 |
0.00000000025 |
0.000000005 |
0.0000069 |
highlight_arrays | 0.000442 | -0.861 |
| Thaps_hclust_0261 |
 |
 |
0.00000000025 |
0.000000005 |
0.0000069 |
diel_light_vs_dark | 0.781000 | -0.063 |
| Thaps_hclust_0261 |
 |
 |
0.00000000025 |
0.000000005 |
0.0000069 |
lowFe_KTKB_Day3 | 0.936000 | -0.0189 |
| Thaps_hclust_0261 |
 |
 |
0.00000000025 |
0.000000005 |
0.0000069 |
lowFe_KTKB_Day5 | 0.884000 | -0.0282 |
| Thaps_hclust_0261 |
 |
 |
0.00000000025 |
0.000000005 |
0.0000069 |
BaP | 0.656000 | 0.086 |
| Thaps_hclust_0261 |
 |
 |
0.00000000025 |
0.000000005 |
0.0000069 |
exponential_vs_stationary_24highlight | 0.008460 | 0.228 |
| Thaps_hclust_0261 |
 |
 |
0.00000000025 |
0.000000005 |
0.0000069 |
co2_elevated_stat_arrays | 0.947000 | -0.0211 |
| Thaps_hclust_0261 |
 |
 |
0.00000000025 |
0.000000005 |
0.0000069 |
lowtemp_TMEVA | 0.872000 | 0.0392 |
| Thaps_hclust_0261 |
 |
 |
0.00000000025 |
0.000000005 |
0.0000069 |
highpH_TMEVA | 0.238000 | -0.158 |
| Thaps_hclust_0261 |
 |
 |
0.00000000025 |
0.000000005 |
0.0000069 |
co2_elevated_expo_arrays | 0.911000 | 0.0498 |
