Hierarchical Clusters
Displaying 4301 - 4400 of 7500
| Title | Cluster Plot | Dendrogram | e-value | e-value | e-value | Condition | Condition FDR | Condition Difference |
|---|---|---|---|---|---|---|---|---|
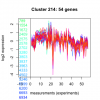
| Thaps_hclust_0214 |
 |
 |
0.00006 |
0.0000000031 |
0.00076 |
lowFe_KTKB_Day5 | 0.375000 | -0.113 |
| Thaps_hclust_0214 |
 |
 |
0.00006 |
0.0000000031 |
0.00076 |
BaP | 0.000370 | 0.521 |
| Thaps_hclust_0214 |
 |
 |
0.00006 |
0.0000000031 |
0.00076 |
exponential_vs_stationary_24highlight | 0.009570 | 0.157 |
| Thaps_hclust_0214 |
 |
 |
0.00006 |
0.0000000031 |
0.00076 |
co2_elevated_stat_arrays | 0.000658 | -0.591 |
| Thaps_hclust_0214 |
 |
 |
0.00006 |
0.0000000031 |
0.00076 |
lowtemp_TMEVA | 0.825000 | -0.0432 |
| Title | Cluster Plot | Dendrogram | e-value | e-value | e-value | Condition | Condition FDR | Condition Difference |
|---|---|---|---|---|---|---|---|---|
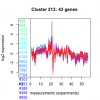
| Thaps_hclust_0213 |
 |
 |
0.0000045 |
0.075 |
0.54 |
lowtemp_TMEVA | 0.002080 | -0.529 |
| Thaps_hclust_0213 |
 |
 |
0.0000045 |
0.075 |
0.54 |
highpH_TMEVA | 0.023100 | 0.25 |
| Thaps_hclust_0213 |
 |
 |
0.0000045 |
0.075 |
0.54 |
co2_elevated_expo_arrays | 0.732000 | 0.0843 |
| Thaps_hclust_0213 |
 |
 |
0.0000045 |
0.075 |
0.54 |
lowFe_TMEVA | 0.316000 | -0.219 |
| Thaps_hclust_0213 |
 |
 |
0.0000045 |
0.075 |
0.54 |
exponential_vs_stationary_24light | 0.004040 | 0.605 |
| Thaps_hclust_0213 |
 |
 |
0.0000045 |
0.075 |
0.54 |
lowN_TMEVA | 0.861000 | -0.0585 |
| Thaps_hclust_0213 |
 |
 |
0.0000045 |
0.075 |
0.54 |
diel_exponential_vs_stationary | 0.000602 | -0.489 |
| Thaps_hclust_0213 |
 |
 |
0.0000045 |
0.075 |
0.54 |
lowSi_TMEVA | 0.002330 | -0.873 |
| Thaps_hclust_0213 |
 |
 |
0.0000045 |
0.075 |
0.54 |
highlight_arrays | 0.123000 | -0.172 |
| Thaps_hclust_0213 |
 |
 |
0.0000045 |
0.075 |
0.54 |
diel_light_vs_dark | 0.000485 | 1.16 |
| Thaps_hclust_0213 |
 |
 |
0.0000045 |
0.075 |
0.54 |
lowFe_KTKB_Day3 | 0.125000 | -0.237 |
| Thaps_hclust_0213 |
 |
 |
0.0000045 |
0.075 |
0.54 |
lowFe_KTKB_Day5 | 0.956000 | -0.0108 |
| Thaps_hclust_0213 |
 |
 |
0.0000045 |
0.075 |
0.54 |
BaP | 0.000370 | 1.48 |
| Thaps_hclust_0213 |
 |
 |
0.0000045 |
0.075 |
0.54 |
exponential_vs_stationary_24highlight | 0.001300 | 0.21 |
| Thaps_hclust_0213 |
 |
 |
0.0000045 |
0.075 |
0.54 |
co2_elevated_stat_arrays | 0.000658 | -0.49 |
| Title | Cluster Plot | Dendrogram | e-value | e-value | e-value | Condition | Condition FDR | Condition Difference |
|---|---|---|---|---|---|---|---|---|
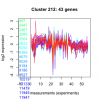
| Thaps_hclust_0212 |
 |
 |
2.5e-17 |
0.000019 |
0.027 |
co2_elevated_stat_arrays | 0.475000 | -0.153 |
| Thaps_hclust_0212 |
 |
 |
2.5e-17 |
0.000019 |
0.027 |
lowtemp_TMEVA | 0.915000 | 0.0251 |
| Thaps_hclust_0212 |
 |
 |
2.5e-17 |
0.000019 |
0.027 |
highpH_TMEVA | 0.274000 | 0.132 |
| Thaps_hclust_0212 |
 |
 |
2.5e-17 |
0.000019 |
0.027 |
co2_elevated_expo_arrays | 0.987000 | 0.00733 |
| Thaps_hclust_0212 |
 |
 |
2.5e-17 |
0.000019 |
0.027 |
lowFe_TMEVA | 0.426000 | -0.186 |
| Thaps_hclust_0212 |
 |
 |
2.5e-17 |
0.000019 |
0.027 |
exponential_vs_stationary_24light | 0.684000 | 0.126 |
| Thaps_hclust_0212 |
 |
 |
2.5e-17 |
0.000019 |
0.027 |
lowN_TMEVA | 0.944000 | -0.0263 |
| Thaps_hclust_0212 |
 |
 |
2.5e-17 |
0.000019 |
0.027 |
diel_exponential_vs_stationary | 0.000602 | -0.376 |
| Thaps_hclust_0212 |
 |
 |
2.5e-17 |
0.000019 |
0.027 |
lowSi_TMEVA | 0.004350 | -0.754 |
| Thaps_hclust_0212 |
 |
 |
2.5e-17 |
0.000019 |
0.027 |
highlight_arrays | 0.805000 | 0.0325 |
| Thaps_hclust_0212 |
 |
 |
2.5e-17 |
0.000019 |
0.027 |
diel_light_vs_dark | 0.000485 | 0.886 |
| Thaps_hclust_0212 |
 |
 |
2.5e-17 |
0.000019 |
0.027 |
lowFe_KTKB_Day3 | 0.163000 | -0.216 |
| Thaps_hclust_0212 |
 |
 |
2.5e-17 |
0.000019 |
0.027 |
lowFe_KTKB_Day5 | 0.808000 | -0.0395 |
| Thaps_hclust_0212 |
 |
 |
2.5e-17 |
0.000019 |
0.027 |
BaP | 0.197000 | 0.194 |
| Thaps_hclust_0212 |
 |
 |
2.5e-17 |
0.000019 |
0.027 |
exponential_vs_stationary_24highlight | 0.988000 | 0.00138 |
| Title | Cluster Plot | Dendrogram | e-value | e-value | e-value | Condition | Condition FDR | Condition Difference |
|---|---|---|---|---|---|---|---|---|
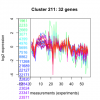
| Thaps_hclust_0211 |
 |
 |
0.000000055 |
0.00014 |
0.026 |
exponential_vs_stationary_24highlight | 0.000926 | 0.263 |
| Thaps_hclust_0211 |
 |
 |
0.000000055 |
0.00014 |
0.026 |
co2_elevated_stat_arrays | 0.165000 | -0.271 |
| Thaps_hclust_0211 |
 |
 |
0.000000055 |
0.00014 |
0.026 |
lowtemp_TMEVA | 0.031300 | -0.436 |
| Thaps_hclust_0211 |
 |
 |
0.000000055 |
0.00014 |
0.026 |
highpH_TMEVA | 0.498000 | 0.097 |
| Thaps_hclust_0211 |
 |
 |
0.000000055 |
0.00014 |
0.026 |
co2_elevated_expo_arrays | 0.358000 | 0.145 |
| Thaps_hclust_0211 |
 |
 |
0.000000055 |
0.00014 |
0.026 |
lowFe_TMEVA | 0.709000 | -0.12 |
| Thaps_hclust_0211 |
 |
 |
0.000000055 |
0.00014 |
0.026 |
exponential_vs_stationary_24light | 0.000581 | 0.755 |
| Thaps_hclust_0211 |
 |
 |
0.000000055 |
0.00014 |
0.026 |
lowN_TMEVA | 0.067200 | -0.477 |
| Thaps_hclust_0211 |
 |
 |
0.000000055 |
0.00014 |
0.026 |
diel_exponential_vs_stationary | 0.991000 | -0.00345 |
| Thaps_hclust_0211 |
 |
 |
0.000000055 |
0.00014 |
0.026 |
lowSi_TMEVA | 0.001350 | -0.976 |
| Thaps_hclust_0211 |
 |
 |
0.000000055 |
0.00014 |
0.026 |
highlight_arrays | 0.548000 | -0.0856 |
| Thaps_hclust_0211 |
 |
 |
0.000000055 |
0.00014 |
0.026 |
diel_light_vs_dark | 0.000485 | 0.967 |
| Thaps_hclust_0211 |
 |
 |
0.000000055 |
0.00014 |
0.026 |
lowFe_KTKB_Day3 | 0.926000 | -0.022 |
| Thaps_hclust_0211 |
 |
 |
0.000000055 |
0.00014 |
0.026 |
lowFe_KTKB_Day5 | 0.639000 | 0.0835 |
| Thaps_hclust_0211 |
 |
 |
0.000000055 |
0.00014 |
0.026 |
BaP | 0.038400 | 0.335 |
| Title | Cluster Plot | Dendrogram | e-value | e-value | e-value | Condition | Condition FDR | Condition Difference |
|---|---|---|---|---|---|---|---|---|
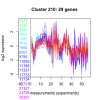
| Thaps_hclust_0210 |
 |
 |
0.0000000000046 |
0.0000033 |
0.086 |
BaP | 0.259000 | 0.206 |
| Thaps_hclust_0210 |
 |
 |
0.0000000000046 |
0.0000033 |
0.086 |
exponential_vs_stationary_24highlight | 0.000526 | 0.747 |
| Thaps_hclust_0210 |
 |
 |
0.0000000000046 |
0.0000033 |
0.086 |
co2_elevated_stat_arrays | 0.296000 | 0.222 |
| Thaps_hclust_0210 |
 |
 |
0.0000000000046 |
0.0000033 |
0.086 |
lowtemp_TMEVA | 0.066100 | -0.389 |
| Thaps_hclust_0210 |
 |
 |
0.0000000000046 |
0.0000033 |
0.086 |
highpH_TMEVA | 0.942000 | 0.0188 |
| Thaps_hclust_0210 |
 |
 |
0.0000000000046 |
0.0000033 |
0.086 |
co2_elevated_expo_arrays | 0.386000 | 0.143 |
| Thaps_hclust_0210 |
 |
 |
0.0000000000046 |
0.0000033 |
0.086 |
lowFe_TMEVA | 0.947000 | -0.0298 |
| Thaps_hclust_0210 |
 |
 |
0.0000000000046 |
0.0000033 |
0.086 |
exponential_vs_stationary_24light | 0.000581 | 2.07 |
| Thaps_hclust_0210 |
 |
 |
0.0000000000046 |
0.0000033 |
0.086 |
lowN_TMEVA | 0.001190 | -1.33 |
| Thaps_hclust_0210 |
 |
 |
0.0000000000046 |
0.0000033 |
0.086 |
diel_exponential_vs_stationary | 0.000602 | 0.741 |
| Thaps_hclust_0210 |
 |
 |
0.0000000000046 |
0.0000033 |
0.086 |
lowSi_TMEVA | 0.001350 | -1.17 |
| Thaps_hclust_0210 |
 |
 |
0.0000000000046 |
0.0000033 |
0.086 |
highlight_arrays | 0.000847 | -0.435 |
| Thaps_hclust_0210 |
 |
 |
0.0000000000046 |
0.0000033 |
0.086 |
diel_light_vs_dark | 0.000485 | 1.39 |
| Thaps_hclust_0210 |
 |
 |
0.0000000000046 |
0.0000033 |
0.086 |
lowFe_KTKB_Day3 | 0.097200 | 0.32 |
| Thaps_hclust_0210 |
 |
 |
0.0000000000046 |
0.0000033 |
0.086 |
lowFe_KTKB_Day5 | 0.744000 | -0.0619 |
| Title | Cluster Plot | Dendrogram | e-value | e-value | e-value | Condition | Condition FDR | Condition Difference |
|---|---|---|---|---|---|---|---|---|
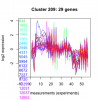
| Thaps_hclust_0209 |
 |
 |
1.2e-16 |
0.00011 |
0.000027 |
lowFe_KTKB_Day5 | 0.015400 | 0.384 |
| Thaps_hclust_0209 |
 |
 |
1.2e-16 |
0.00011 |
0.000027 |
BaP | 0.004070 | 0.486 |
| Thaps_hclust_0209 |
 |
 |
1.2e-16 |
0.00011 |
0.000027 |
exponential_vs_stationary_24highlight | 0.300000 | 0.0935 |
| Thaps_hclust_0209 |
 |
 |
1.2e-16 |
0.00011 |
0.000027 |
co2_elevated_stat_arrays | 0.642000 | -0.118 |
| Thaps_hclust_0209 |
 |
 |
1.2e-16 |
0.00011 |
0.000027 |
lowtemp_TMEVA | 0.102000 | 0.348 |
| Thaps_hclust_0209 |
 |
 |
1.2e-16 |
0.00011 |
0.000027 |
highpH_TMEVA | 0.001370 | -0.425 |
| Thaps_hclust_0209 |
 |
 |
1.2e-16 |
0.00011 |
0.000027 |
co2_elevated_expo_arrays | 0.443000 | 0.133 |
| Thaps_hclust_0209 |
 |
 |
1.2e-16 |
0.00011 |
0.000027 |
lowFe_TMEVA | 0.853000 | -0.0712 |
| Thaps_hclust_0209 |
 |
 |
1.2e-16 |
0.00011 |
0.000027 |
exponential_vs_stationary_24light | 0.000581 | 1.36 |
| Thaps_hclust_0209 |
 |
 |
1.2e-16 |
0.00011 |
0.000027 |
lowN_TMEVA | 0.003130 | -0.73 |
| Thaps_hclust_0209 |
 |
 |
1.2e-16 |
0.00011 |
0.000027 |
diel_exponential_vs_stationary | 0.151000 | 0.209 |
| Thaps_hclust_0209 |
 |
 |
1.2e-16 |
0.00011 |
0.000027 |
lowSi_TMEVA | 0.018000 | -0.742 |
| Thaps_hclust_0209 |
 |
 |
1.2e-16 |
0.00011 |
0.000027 |
highlight_arrays | 0.000442 | -0.667 |
| Thaps_hclust_0209 |
 |
 |
1.2e-16 |
0.00011 |
0.000027 |
diel_light_vs_dark | 0.000485 | 0.738 |
| Thaps_hclust_0209 |
 |
 |
1.2e-16 |
0.00011 |
0.000027 |
lowFe_KTKB_Day3 | 0.000862 | 0.919 |
| Title | Cluster Plot | Dendrogram | e-value | e-value | e-value | Condition | Condition FDR | Condition Difference |
|---|---|---|---|---|---|---|---|---|
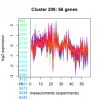
| Thaps_hclust_0208 |
 |
|
1.2e-20 |
0.0000000000000057 |
0.0000000099 |
lowFe_KTKB_Day3 | 0.968000 | -0.00748 |
| Thaps_hclust_0208 |
 |
|
1.2e-20 |
0.0000000000000057 |
0.0000000099 |
lowFe_KTKB_Day5 | 0.561000 | -0.0717 |
| Thaps_hclust_0208 |
 |
|
1.2e-20 |
0.0000000000000057 |
0.0000000099 |
BaP | 0.000370 | 0.466 |
| Thaps_hclust_0208 |
 |
|
1.2e-20 |
0.0000000000000057 |
0.0000000099 |
exponential_vs_stationary_24highlight | 0.000526 | 0.404 |
| Thaps_hclust_0208 |
 |
|
1.2e-20 |
0.0000000000000057 |
0.0000000099 |
co2_elevated_stat_arrays | 0.000658 | -0.474 |
| Thaps_hclust_0208 |
 |
|
1.2e-20 |
0.0000000000000057 |
0.0000000099 |
lowtemp_TMEVA | 0.800000 | 0.0444 |
| Thaps_hclust_0208 |
 |
|
1.2e-20 |
0.0000000000000057 |
0.0000000099 |
highpH_TMEVA | 0.329000 | 0.102 |
| Thaps_hclust_0208 |
 |
|
1.2e-20 |
0.0000000000000057 |
0.0000000099 |
co2_elevated_expo_arrays | 0.985000 | -0.014 |
| Thaps_hclust_0208 |
 |
|
1.2e-20 |
0.0000000000000057 |
0.0000000099 |
lowFe_TMEVA | 0.996000 | -0.00415 |
| Thaps_hclust_0208 |
 |
|
1.2e-20 |
0.0000000000000057 |
0.0000000099 |
exponential_vs_stationary_24light | 0.000581 | 0.911 |
| Thaps_hclust_0208 |
 |
|
1.2e-20 |
0.0000000000000057 |
0.0000000099 |
lowN_TMEVA | 0.001190 | -0.59 |
| Thaps_hclust_0208 |
 |
|
1.2e-20 |
0.0000000000000057 |
0.0000000099 |
diel_exponential_vs_stationary | 0.099000 | 0.161 |
| Thaps_hclust_0208 |
 |
|
1.2e-20 |
0.0000000000000057 |
0.0000000099 |
lowSi_TMEVA | 0.445000 | -0.334 |
| Thaps_hclust_0208 |
 |
|
1.2e-20 |
0.0000000000000057 |
0.0000000099 |
highlight_arrays | 0.002290 | -0.269 |
| Thaps_hclust_0208 |
 |
|
1.2e-20 |
0.0000000000000057 |
0.0000000099 |
diel_light_vs_dark | 0.000485 | 0.714 |
| Title | Cluster Plot | Dendrogram | e-value | e-value | e-value | Condition | Condition FDR | Condition Difference |
|---|---|---|---|---|---|---|---|---|
| Thaps_hclust_0207 |
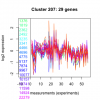 |
 |
0.0000000025 |
0.0000000037 |
0.1 |
diel_light_vs_dark | 0.000485 | 0.569 |
| Thaps_hclust_0207 |
 |
 |
0.0000000025 |
0.0000000037 |
0.1 |
lowFe_KTKB_Day3 | 0.802000 | 0.0585 |
| Thaps_hclust_0207 |
 |
 |
0.0000000025 |
0.0000000037 |
0.1 |
lowFe_KTKB_Day5 | 0.964000 | 0.0107 |
| Thaps_hclust_0207 |
 |
 |
0.0000000025 |
0.0000000037 |
0.1 |
BaP | 0.777000 | 0.0599 |
| Thaps_hclust_0207 |
 |
 |
0.0000000025 |
0.0000000037 |
0.1 |
exponential_vs_stationary_24highlight | 0.000526 | 0.302 |
