Hierarchical Clusters
Displaying 4601 - 4700 of 7500
| Title | Cluster Plot | Dendrogram | e-value | e-value | e-value | Condition | Condition FDR | Condition Difference |
|---|---|---|---|---|---|---|---|---|
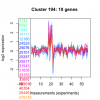
| Thaps_hclust_0194 |
 |
 |
0.27 |
0.6 |
1.5 |
lowFe_KTKB_Day5 | 0.684000 | -0.0943 |
| Thaps_hclust_0194 |
 |
 |
0.27 |
0.6 |
1.5 |
BaP | 0.000370 | 1.47 |
| Thaps_hclust_0194 |
 |
 |
0.27 |
0.6 |
1.5 |
exponential_vs_stationary_24highlight | 0.541000 | -0.0766 |
| Thaps_hclust_0194 |
 |
 |
0.27 |
0.6 |
1.5 |
co2_elevated_stat_arrays | 0.075500 | -0.405 |
| Thaps_hclust_0194 |
 |
 |
0.27 |
0.6 |
1.5 |
lowtemp_TMEVA | 0.944000 | -0.0235 |
| Title | Cluster Plot | Dendrogram | e-value | e-value | e-value | Condition | Condition FDR | Condition Difference |
|---|---|---|---|---|---|---|---|---|
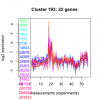
| Thaps_hclust_0193 |
 |
 |
0.00027 |
0.013 |
6.2 |
lowtemp_TMEVA | 0.768000 | -0.0803 |
| Thaps_hclust_0193 |
 |
 |
0.00027 |
0.013 |
6.2 |
highpH_TMEVA | 0.114000 | -0.24 |
| Thaps_hclust_0193 |
 |
 |
0.00027 |
0.013 |
6.2 |
co2_elevated_expo_arrays | 0.976000 | 0.02 |
| Thaps_hclust_0193 |
 |
 |
0.00027 |
0.013 |
6.2 |
lowFe_TMEVA | 0.853000 | -0.0736 |
| Thaps_hclust_0193 |
 |
 |
0.00027 |
0.013 |
6.2 |
exponential_vs_stationary_24light | 0.290000 | 0.33 |
| Thaps_hclust_0193 |
 |
 |
0.00027 |
0.013 |
6.2 |
lowN_TMEVA | 0.227000 | -0.391 |
| Thaps_hclust_0193 |
 |
 |
0.00027 |
0.013 |
6.2 |
diel_exponential_vs_stationary | 0.991000 | -0.0036 |
| Thaps_hclust_0193 |
 |
 |
0.00027 |
0.013 |
6.2 |
lowSi_TMEVA | 0.976000 | -0.121 |
| Thaps_hclust_0193 |
 |
 |
0.00027 |
0.013 |
6.2 |
highlight_arrays | 0.000442 | -0.56 |
| Thaps_hclust_0193 |
 |
 |
0.00027 |
0.013 |
6.2 |
diel_light_vs_dark | 0.043700 | 0.378 |
| Thaps_hclust_0193 |
 |
 |
0.00027 |
0.013 |
6.2 |
lowFe_KTKB_Day3 | 0.509000 | 0.164 |
| Thaps_hclust_0193 |
 |
 |
0.00027 |
0.013 |
6.2 |
lowFe_KTKB_Day5 | 0.820000 | 0.0515 |
| Thaps_hclust_0193 |
 |
 |
0.00027 |
0.013 |
6.2 |
BaP | 0.000370 | 1.08 |
| Thaps_hclust_0193 |
 |
 |
0.00027 |
0.013 |
6.2 |
exponential_vs_stationary_24highlight | 0.040300 | 0.201 |
| Thaps_hclust_0193 |
 |
 |
0.00027 |
0.013 |
6.2 |
co2_elevated_stat_arrays | 0.063900 | -0.386 |
| Title | Cluster Plot | Dendrogram | e-value | e-value | e-value | Condition | Condition FDR | Condition Difference |
|---|---|---|---|---|---|---|---|---|
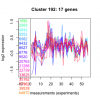
| Thaps_hclust_0192 |
 |
 |
0.000012 |
0.017 |
1.3 |
co2_elevated_stat_arrays | 0.025000 | -0.511 |
| Thaps_hclust_0192 |
 |
 |
0.000012 |
0.017 |
1.3 |
lowtemp_TMEVA | 0.844000 | -0.0651 |
| Thaps_hclust_0192 |
 |
 |
0.000012 |
0.017 |
1.3 |
highpH_TMEVA | 0.021000 | -0.406 |
| Thaps_hclust_0192 |
 |
 |
0.000012 |
0.017 |
1.3 |
co2_elevated_expo_arrays | 0.943000 | -0.0379 |
| Thaps_hclust_0192 |
 |
 |
0.000012 |
0.017 |
1.3 |
lowFe_TMEVA | 0.232000 | -0.351 |
| Thaps_hclust_0192 |
 |
 |
0.000012 |
0.017 |
1.3 |
exponential_vs_stationary_24light | 0.900000 | 0.0518 |
| Thaps_hclust_0192 |
 |
 |
0.000012 |
0.017 |
1.3 |
lowN_TMEVA | 0.489000 | -0.257 |
| Thaps_hclust_0192 |
 |
 |
0.000012 |
0.017 |
1.3 |
diel_exponential_vs_stationary | 0.664000 | -0.0992 |
| Thaps_hclust_0192 |
 |
 |
0.000012 |
0.017 |
1.3 |
lowSi_TMEVA | 0.976000 | -0.116 |
| Thaps_hclust_0192 |
 |
 |
0.000012 |
0.017 |
1.3 |
highlight_arrays | 0.407000 | -0.15 |
| Thaps_hclust_0192 |
 |
 |
0.000012 |
0.017 |
1.3 |
diel_light_vs_dark | 0.902000 | 0.0445 |
| Thaps_hclust_0192 |
 |
 |
0.000012 |
0.017 |
1.3 |
lowFe_KTKB_Day3 | 0.722000 | 0.112 |
| Thaps_hclust_0192 |
 |
 |
0.000012 |
0.017 |
1.3 |
lowFe_KTKB_Day5 | 0.156000 | 0.303 |
| Thaps_hclust_0192 |
 |
 |
0.000012 |
0.017 |
1.3 |
BaP | 0.183000 | 0.318 |
| Thaps_hclust_0192 |
 |
 |
0.000012 |
0.017 |
1.3 |
exponential_vs_stationary_24highlight | 0.657000 | 0.058 |
| Title | Cluster Plot | Dendrogram | e-value | e-value | e-value | Condition | Condition FDR | Condition Difference |
|---|---|---|---|---|---|---|---|---|
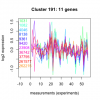
| Thaps_hclust_0191 |
 |
 |
1.5 |
3.5 |
44 |
exponential_vs_stationary_24highlight | 0.387000 | 0.129 |
| Thaps_hclust_0191 |
 |
 |
1.5 |
3.5 |
44 |
co2_elevated_stat_arrays | 0.044700 | -0.542 |
| Thaps_hclust_0191 |
 |
 |
1.5 |
3.5 |
44 |
lowtemp_TMEVA | 0.654000 | 0.158 |
| Thaps_hclust_0191 |
 |
 |
1.5 |
3.5 |
44 |
highpH_TMEVA | 0.807000 | 0.0611 |
| Thaps_hclust_0191 |
 |
 |
1.5 |
3.5 |
44 |
co2_elevated_expo_arrays | 0.934000 | 0.0449 |
| Thaps_hclust_0191 |
 |
 |
1.5 |
3.5 |
44 |
lowFe_TMEVA | 0.693000 | 0.156 |
| Thaps_hclust_0191 |
 |
 |
1.5 |
3.5 |
44 |
exponential_vs_stationary_24light | 0.348000 | 0.389 |
| Thaps_hclust_0191 |
 |
 |
1.5 |
3.5 |
44 |
lowN_TMEVA | 0.332000 | 0.409 |
| Thaps_hclust_0191 |
 |
 |
1.5 |
3.5 |
44 |
diel_exponential_vs_stationary | 0.783000 | 0.0779 |
| Thaps_hclust_0191 |
 |
 |
1.5 |
3.5 |
44 |
lowSi_TMEVA | 0.765000 | 0.284 |
| Thaps_hclust_0191 |
 |
 |
1.5 |
3.5 |
44 |
highlight_arrays | 0.345000 | -0.206 |
| Thaps_hclust_0191 |
 |
 |
1.5 |
3.5 |
44 |
diel_light_vs_dark | 0.787000 | 0.101 |
| Thaps_hclust_0191 |
 |
 |
1.5 |
3.5 |
44 |
lowFe_KTKB_Day3 | 0.744000 | -0.122 |
| Thaps_hclust_0191 |
 |
 |
1.5 |
3.5 |
44 |
lowFe_KTKB_Day5 | 0.715000 | 0.105 |
| Thaps_hclust_0191 |
 |
 |
1.5 |
3.5 |
44 |
BaP | 0.264000 | 0.333 |
| Title | Cluster Plot | Dendrogram | e-value | e-value | e-value | Condition | Condition FDR | Condition Difference |
|---|---|---|---|---|---|---|---|---|
| Thaps_hclust_0190 |
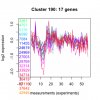 |
 |
0.0000025 |
0.00027 |
0.93 |
BaP | 0.895000 | 0.0437 |
| Thaps_hclust_0190 |
 |
 |
0.0000025 |
0.00027 |
0.93 |
exponential_vs_stationary_24highlight | 0.229000 | 0.142 |
| Thaps_hclust_0190 |
 |
 |
0.0000025 |
0.00027 |
0.93 |
co2_elevated_stat_arrays | 0.475000 | -0.185 |
| Thaps_hclust_0190 |
 |
 |
0.0000025 |
0.00027 |
0.93 |
lowtemp_TMEVA | 0.117000 | 0.439 |
| Thaps_hclust_0190 |
 |
 |
0.0000025 |
0.00027 |
0.93 |
highpH_TMEVA | 0.811000 | 0.0501 |
| Thaps_hclust_0190 |
 |
 |
0.0000025 |
0.00027 |
0.93 |
co2_elevated_expo_arrays | 0.833000 | -0.0731 |
| Thaps_hclust_0190 |
 |
 |
0.0000025 |
0.00027 |
0.93 |
lowFe_TMEVA | 0.951000 | 0.0276 |
| Thaps_hclust_0190 |
 |
 |
0.0000025 |
0.00027 |
0.93 |
exponential_vs_stationary_24light | 0.558000 | 0.223 |
| Thaps_hclust_0190 |
 |
 |
0.0000025 |
0.00027 |
0.93 |
lowN_TMEVA | 0.605000 | -0.198 |
| Thaps_hclust_0190 |
 |
 |
0.0000025 |
0.00027 |
0.93 |
diel_exponential_vs_stationary | 0.503000 | 0.146 |
| Thaps_hclust_0190 |
 |
 |
0.0000025 |
0.00027 |
0.93 |
lowSi_TMEVA | 0.781000 | -0.266 |
| Thaps_hclust_0190 |
 |
 |
0.0000025 |
0.00027 |
0.93 |
highlight_arrays | 0.578000 | -0.106 |
| Thaps_hclust_0190 |
 |
 |
0.0000025 |
0.00027 |
0.93 |
diel_light_vs_dark | 0.532000 | 0.165 |
| Thaps_hclust_0190 |
 |
 |
0.0000025 |
0.00027 |
0.93 |
lowFe_KTKB_Day3 | 0.284000 | 0.282 |
| Thaps_hclust_0190 |
 |
 |
0.0000025 |
0.00027 |
0.93 |
lowFe_KTKB_Day5 | 0.117000 | 0.335 |
| Title | Cluster Plot | Dendrogram | e-value | e-value | e-value | Condition | Condition FDR | Condition Difference |
|---|---|---|---|---|---|---|---|---|
| Thaps_hclust_0189 |
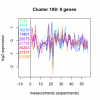 |
 |
0.0012 |
0.00048 |
0.015 |
lowFe_KTKB_Day5 | 0.968000 | 0.0138 |
| Thaps_hclust_0189 |
 |
 |
0.0012 |
0.00048 |
0.015 |
BaP | 0.865000 | 0.0662 |
| Thaps_hclust_0189 |
 |
 |
0.0012 |
0.00048 |
0.015 |
exponential_vs_stationary_24highlight | 0.175000 | 0.215 |
| Thaps_hclust_0189 |
 |
 |
0.0012 |
0.00048 |
0.015 |
co2_elevated_stat_arrays | 0.533000 | -0.192 |
| Thaps_hclust_0189 |
 |
 |
0.0012 |
0.00048 |
0.015 |
lowtemp_TMEVA | 0.082900 | 0.687 |
| Thaps_hclust_0189 |
 |
 |
0.0012 |
0.00048 |
0.015 |
highpH_TMEVA | 0.182000 | 0.295 |
| Thaps_hclust_0189 |
 |
 |
0.0012 |
0.00048 |
0.015 |
co2_elevated_expo_arrays | 0.848000 | 0.0815 |
| Thaps_hclust_0189 |
 |
 |
0.0012 |
0.00048 |
0.015 |
lowFe_TMEVA | 0.951000 | 0.0322 |
| Thaps_hclust_0189 |
 |
 |
0.0012 |
0.00048 |
0.015 |
exponential_vs_stationary_24light | 0.562000 | 0.282 |
| Thaps_hclust_0189 |
 |
 |
0.0012 |
0.00048 |
0.015 |
lowN_TMEVA | 0.866000 | -0.0656 |
| Thaps_hclust_0189 |
 |
 |
0.0012 |
0.00048 |
0.015 |
diel_exponential_vs_stationary | 0.779000 | -0.0896 |
| Thaps_hclust_0189 |
 |
 |
0.0012 |
0.00048 |
0.015 |
lowSi_TMEVA | 1.000000 | -0.0275 |
| Thaps_hclust_0189 |
 |
 |
0.0012 |
0.00048 |
0.015 |
highlight_arrays | 0.988000 | 0.00285 |
| Thaps_hclust_0189 |
 |
 |
0.0012 |
0.00048 |
0.015 |
diel_light_vs_dark | 0.367000 | 0.298 |
| Thaps_hclust_0189 |
 |
 |
0.0012 |
0.00048 |
0.015 |
lowFe_KTKB_Day3 | 0.206000 | -0.44 |
| Title | Cluster Plot | Dendrogram | e-value | e-value | e-value | Condition | Condition FDR | Condition Difference |
|---|---|---|---|---|---|---|---|---|
| Thaps_hclust_0188 |
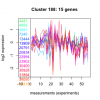 |
 |
0.0058 |
0.31 |
0.34 |
lowFe_KTKB_Day3 | 0.447000 | -0.222 |
| Thaps_hclust_0188 |
 |
 |
0.0058 |
0.31 |
0.34 |
lowFe_KTKB_Day5 | 0.477000 | -0.178 |
| Thaps_hclust_0188 |
 |
 |
0.0058 |
0.31 |
0.34 |
BaP | 0.388000 | 0.221 |
| Thaps_hclust_0188 |
 |
 |
0.0058 |
0.31 |
0.34 |
exponential_vs_stationary_24highlight | 0.002480 | 0.382 |
| Thaps_hclust_0188 |
 |
 |
0.0058 |
0.31 |
0.34 |
co2_elevated_stat_arrays | 0.011500 | -0.562 |
| Thaps_hclust_0188 |
 |
 |
0.0058 |
0.31 |
0.34 |
lowtemp_TMEVA | 0.442000 | 0.223 |
| Thaps_hclust_0188 |
 |
 |
0.0058 |
0.31 |
0.34 |
highpH_TMEVA | 0.306000 | -0.189 |
| Thaps_hclust_0188 |
 |
 |
0.0058 |
0.31 |
0.34 |
co2_elevated_expo_arrays | 0.647000 | 0.118 |
| Thaps_hclust_0188 |
 |
 |
0.0058 |
0.31 |
0.34 |
lowFe_TMEVA | 0.888000 | -0.0592 |
| Thaps_hclust_0188 |
 |
 |
0.0058 |
0.31 |
0.34 |
exponential_vs_stationary_24light | 0.119000 | 0.546 |
| Thaps_hclust_0188 |
 |
 |
0.0058 |
0.31 |
0.34 |
lowN_TMEVA | 0.861000 | 0.0669 |
| Thaps_hclust_0188 |
 |
 |
0.0058 |
0.31 |
0.34 |
diel_exponential_vs_stationary | 0.734000 | -0.0841 |
| Thaps_hclust_0188 |
 |
 |
0.0058 |
0.31 |
0.34 |
lowSi_TMEVA | 1.000000 | -0.0387 |
| Thaps_hclust_0188 |
 |
 |
0.0058 |
0.31 |
0.34 |
highlight_arrays | 0.460000 | -0.143 |
| Thaps_hclust_0188 |
 |
 |
0.0058 |
0.31 |
0.34 |
diel_light_vs_dark | 0.966000 | 0.0177 |
| Title | Cluster Plot | Dendrogram | e-value | e-value | e-value | Condition | Condition FDR | Condition Difference |
|---|---|---|---|---|---|---|---|---|
| Thaps_hclust_0187 |
 |
 |
0.000000024 |
0.034 |
0.66 |
diel_light_vs_dark | 0.046000 | 0.323 |
| Thaps_hclust_0187 |
 |
 |
0.000000024 |
0.034 |
0.66 |
lowFe_KTKB_Day3 | 0.992000 | -0.00322 |
| Thaps_hclust_0187 |
 |
 |
0.000000024 |
0.034 |
0.66 |
lowFe_KTKB_Day5 | 0.306000 | 0.174 |
| Thaps_hclust_0187 |
 |
 |
0.000000024 |
0.034 |
0.66 |
BaP | 0.859000 | -0.0398 |
| Thaps_hclust_0187 |
 |
 |
0.000000024 |
0.034 |
0.66 |
exponential_vs_stationary_24highlight | 0.000926 | 0.255 |
