Hierarchical Clusters
Displaying 7201 - 7300 of 7500
| Title | Cluster Plot | Dendrogram | e-value | e-value | e-value | Condition | Condition FDR | Condition Difference |
|---|---|---|---|---|---|---|---|---|
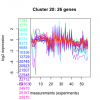
| Thaps_hclust_0020 |
 |
 |
0.004 |
0.15 |
3.3 |
diel_light_vs_dark | 0.000485 | -1.59 |
| Thaps_hclust_0020 |
 |
 |
0.004 |
0.15 |
3.3 |
lowFe_KTKB_Day3 | 0.272000 | -0.235 |
| Thaps_hclust_0020 |
 |
 |
0.004 |
0.15 |
3.3 |
lowFe_KTKB_Day5 | 0.629000 | -0.0947 |
| Thaps_hclust_0020 |
 |
 |
0.004 |
0.15 |
3.3 |
BaP | 0.000370 | -0.867 |
| Thaps_hclust_0020 |
 |
 |
0.004 |
0.15 |
3.3 |
exponential_vs_stationary_24highlight | 0.071400 | 0.16 |
| Thaps_hclust_0020 |
 |
 |
0.004 |
0.15 |
3.3 |
co2_elevated_stat_arrays | 0.229000 | -0.254 |
| Thaps_hclust_0020 |
 |
 |
0.004 |
0.15 |
3.3 |
lowtemp_TMEVA | 0.033100 | -0.479 |
| Thaps_hclust_0020 |
 |
 |
0.004 |
0.15 |
3.3 |
highpH_TMEVA | 0.600000 | 0.0859 |
| Thaps_hclust_0020 |
 |
 |
0.004 |
0.15 |
3.3 |
co2_elevated_expo_arrays | 0.739000 | 0.0906 |
| Thaps_hclust_0020 |
 |
 |
0.004 |
0.15 |
3.3 |
lowFe_TMEVA | 0.005360 | -0.604 |
| Thaps_hclust_0020 |
 |
 |
0.004 |
0.15 |
3.3 |
exponential_vs_stationary_24light | 0.089400 | 0.469 |
| Thaps_hclust_0020 |
 |
 |
0.004 |
0.15 |
3.3 |
lowN_TMEVA | 0.011400 | -0.698 |
| Thaps_hclust_0020 |
 |
 |
0.004 |
0.15 |
3.3 |
diel_exponential_vs_stationary | 0.154000 | 0.219 |
| Thaps_hclust_0020 |
 |
 |
0.004 |
0.15 |
3.3 |
lowSi_TMEVA | 0.259000 | -0.488 |
| Thaps_hclust_0020 |
 |
 |
0.004 |
0.15 |
3.3 |
highlight_arrays | 0.075500 | -0.248 |
| Title | Cluster Plot | Dendrogram | e-value | e-value | e-value | Condition | Condition FDR | Condition Difference |
|---|---|---|---|---|---|---|---|---|
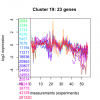
| Thaps_hclust_0019 |
 |
 |
0.0000001 |
0.00000017 |
0.000037 |
highlight_arrays | 0.016300 | 0.344 |
| Thaps_hclust_0019 |
 |
 |
0.0000001 |
0.00000017 |
0.000037 |
diel_light_vs_dark | 0.213000 | -0.247 |
| Thaps_hclust_0019 |
 |
 |
0.0000001 |
0.00000017 |
0.000037 |
lowFe_KTKB_Day3 | 0.744000 | 0.0923 |
| Thaps_hclust_0019 |
 |
 |
0.0000001 |
0.00000017 |
0.000037 |
lowFe_KTKB_Day5 | 0.337000 | 0.185 |
| Thaps_hclust_0019 |
 |
 |
0.0000001 |
0.00000017 |
0.000037 |
BaP | 0.005590 | -0.532 |
| Thaps_hclust_0019 |
 |
 |
0.0000001 |
0.00000017 |
0.000037 |
exponential_vs_stationary_24highlight | 0.101000 | 0.158 |
| Thaps_hclust_0019 |
 |
 |
0.0000001 |
0.00000017 |
0.000037 |
co2_elevated_stat_arrays | 0.302000 | 0.233 |
| Thaps_hclust_0019 |
 |
 |
0.0000001 |
0.00000017 |
0.000037 |
lowtemp_TMEVA | 0.884000 | -0.0408 |
| Thaps_hclust_0019 |
 |
 |
0.0000001 |
0.00000017 |
0.000037 |
highpH_TMEVA | 0.013400 | 0.36 |
| Thaps_hclust_0019 |
 |
 |
0.0000001 |
0.00000017 |
0.000037 |
co2_elevated_expo_arrays | 0.848000 | -0.0679 |
| Thaps_hclust_0019 |
 |
 |
0.0000001 |
0.00000017 |
0.000037 |
lowFe_TMEVA | 0.803000 | -0.097 |
| Thaps_hclust_0019 |
 |
 |
0.0000001 |
0.00000017 |
0.000037 |
exponential_vs_stationary_24light | 0.002660 | 0.842 |
| Thaps_hclust_0019 |
 |
 |
0.0000001 |
0.00000017 |
0.000037 |
lowN_TMEVA | 0.006600 | -0.793 |
| Thaps_hclust_0019 |
 |
 |
0.0000001 |
0.00000017 |
0.000037 |
diel_exponential_vs_stationary | 0.000602 | 0.644 |
| Thaps_hclust_0019 |
 |
 |
0.0000001 |
0.00000017 |
0.000037 |
lowSi_TMEVA | 0.832000 | -0.227 |
| Title | Cluster Plot | Dendrogram | e-value | e-value | e-value | Condition | Condition FDR | Condition Difference |
|---|---|---|---|---|---|---|---|---|
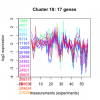
| Thaps_hclust_0018 |
 |
 |
0.065 |
0.38 |
0.16 |
lowSi_TMEVA | 0.557000 | -0.386 |
| Thaps_hclust_0018 |
 |
 |
0.065 |
0.38 |
0.16 |
highlight_arrays | 0.000442 | 0.572 |
| Thaps_hclust_0018 |
 |
 |
0.065 |
0.38 |
0.16 |
diel_light_vs_dark | 0.000926 | -0.665 |
| Thaps_hclust_0018 |
 |
 |
0.065 |
0.38 |
0.16 |
lowFe_KTKB_Day3 | 0.968000 | -0.0158 |
| Thaps_hclust_0018 |
 |
 |
0.065 |
0.38 |
0.16 |
lowFe_KTKB_Day5 | 0.208000 | 0.274 |
| Thaps_hclust_0018 |
 |
 |
0.065 |
0.38 |
0.16 |
BaP | 0.284000 | -0.259 |
| Thaps_hclust_0018 |
 |
 |
0.065 |
0.38 |
0.16 |
exponential_vs_stationary_24highlight | 0.395000 | -0.103 |
| Thaps_hclust_0018 |
 |
 |
0.065 |
0.38 |
0.16 |
co2_elevated_stat_arrays | 0.000658 | 1.14 |
| Thaps_hclust_0018 |
 |
 |
0.065 |
0.38 |
0.16 |
lowtemp_TMEVA | 0.458000 | 0.207 |
| Thaps_hclust_0018 |
 |
 |
0.065 |
0.38 |
0.16 |
highpH_TMEVA | 0.018500 | 0.42 |
| Thaps_hclust_0018 |
 |
 |
0.065 |
0.38 |
0.16 |
co2_elevated_expo_arrays | 0.230000 | 0.204 |
| Thaps_hclust_0018 |
 |
 |
0.065 |
0.38 |
0.16 |
lowFe_TMEVA | 0.508000 | -0.205 |
| Thaps_hclust_0018 |
 |
 |
0.065 |
0.38 |
0.16 |
exponential_vs_stationary_24light | 0.604000 | 0.202 |
| Thaps_hclust_0018 |
 |
 |
0.065 |
0.38 |
0.16 |
lowN_TMEVA | 0.051700 | -0.671 |
| Thaps_hclust_0018 |
 |
 |
0.065 |
0.38 |
0.16 |
diel_exponential_vs_stationary | 0.000602 | 0.915 |
| Title | Cluster Plot | Dendrogram | e-value | e-value | e-value | Condition | Condition FDR | Condition Difference |
|---|---|---|---|---|---|---|---|---|
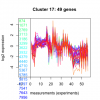
| Thaps_hclust_0017 |
 |
 |
4.6e-24 |
0.00000000000046 |
0.000000000000098 |
diel_exponential_vs_stationary | 0.000602 | 1.06 |
| Thaps_hclust_0017 |
 |
 |
4.6e-24 |
0.00000000000046 |
0.000000000000098 |
lowSi_TMEVA | 0.001350 | -1.05 |
| Thaps_hclust_0017 |
 |
 |
4.6e-24 |
0.00000000000046 |
0.000000000000098 |
highlight_arrays | 0.000442 | -0.678 |
| Thaps_hclust_0017 |
 |
 |
4.6e-24 |
0.00000000000046 |
0.000000000000098 |
diel_light_vs_dark | 0.000485 | -0.939 |
| Thaps_hclust_0017 |
 |
 |
4.6e-24 |
0.00000000000046 |
0.000000000000098 |
lowFe_KTKB_Day3 | 0.000862 | 1.67 |
| Thaps_hclust_0017 |
 |
 |
4.6e-24 |
0.00000000000046 |
0.000000000000098 |
lowFe_KTKB_Day5 | 0.001320 | 0.772 |
| Thaps_hclust_0017 |
 |
 |
4.6e-24 |
0.00000000000046 |
0.000000000000098 |
BaP | 0.022800 | -0.302 |
| Thaps_hclust_0017 |
 |
 |
4.6e-24 |
0.00000000000046 |
0.000000000000098 |
exponential_vs_stationary_24highlight | 0.000526 | 0.31 |
| Thaps_hclust_0017 |
 |
 |
4.6e-24 |
0.00000000000046 |
0.000000000000098 |
co2_elevated_stat_arrays | 0.064400 | 0.292 |
| Thaps_hclust_0017 |
 |
 |
4.6e-24 |
0.00000000000046 |
0.000000000000098 |
lowtemp_TMEVA | 0.297000 | 0.177 |
| Thaps_hclust_0017 |
 |
 |
4.6e-24 |
0.00000000000046 |
0.000000000000098 |
highpH_TMEVA | 0.851000 | -0.0286 |
| Thaps_hclust_0017 |
 |
 |
4.6e-24 |
0.00000000000046 |
0.000000000000098 |
co2_elevated_expo_arrays | 0.025000 | 0.206 |
| Thaps_hclust_0017 |
 |
 |
4.6e-24 |
0.00000000000046 |
0.000000000000098 |
lowFe_TMEVA | 0.001040 | -0.751 |
| Thaps_hclust_0017 |
 |
 |
4.6e-24 |
0.00000000000046 |
0.000000000000098 |
exponential_vs_stationary_24light | 0.000581 | 1.74 |
| Thaps_hclust_0017 |
 |
 |
4.6e-24 |
0.00000000000046 |
0.000000000000098 |
lowN_TMEVA | 0.001190 | -0.978 |
| Title | Cluster Plot | Dendrogram | e-value | e-value | e-value | Condition | Condition FDR | Condition Difference |
|---|---|---|---|---|---|---|---|---|
| Thaps_hclust_0016 |
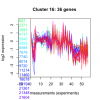 |
 |
0.000000000083 |
0.00000025 |
0.00000028 |
lowN_TMEVA | 0.001190 | -1.44 |
| Thaps_hclust_0016 |
 |
 |
0.000000000083 |
0.00000025 |
0.00000028 |
diel_exponential_vs_stationary | 0.000602 | 0.727 |
| Thaps_hclust_0016 |
 |
 |
0.000000000083 |
0.00000025 |
0.00000028 |
lowSi_TMEVA | 0.001350 | -1.17 |
| Thaps_hclust_0016 |
 |
 |
0.000000000083 |
0.00000025 |
0.00000028 |
highlight_arrays | 0.001240 | -0.36 |
| Thaps_hclust_0016 |
 |
 |
0.000000000083 |
0.00000025 |
0.00000028 |
diel_light_vs_dark | 0.000485 | -1.21 |
| Thaps_hclust_0016 |
 |
 |
0.000000000083 |
0.00000025 |
0.00000028 |
lowFe_KTKB_Day3 | 0.936000 | 0.0192 |
| Thaps_hclust_0016 |
 |
 |
0.000000000083 |
0.00000025 |
0.00000028 |
lowFe_KTKB_Day5 | 0.216000 | 0.188 |
| Thaps_hclust_0016 |
 |
 |
0.000000000083 |
0.00000025 |
0.00000028 |
BaP | 0.305000 | -0.172 |
| Thaps_hclust_0016 |
 |
 |
0.000000000083 |
0.00000025 |
0.00000028 |
exponential_vs_stationary_24highlight | 0.000526 | 0.416 |
| Thaps_hclust_0016 |
 |
 |
0.000000000083 |
0.00000025 |
0.00000028 |
co2_elevated_stat_arrays | 0.711000 | -0.095 |
| Thaps_hclust_0016 |
 |
 |
0.000000000083 |
0.00000025 |
0.00000028 |
lowtemp_TMEVA | 0.578000 | 0.114 |
| Thaps_hclust_0016 |
 |
 |
0.000000000083 |
0.00000025 |
0.00000028 |
highpH_TMEVA | 0.608000 | 0.0733 |
| Thaps_hclust_0016 |
 |
 |
0.000000000083 |
0.00000025 |
0.00000028 |
co2_elevated_expo_arrays | 0.833000 | 0.0695 |
| Thaps_hclust_0016 |
 |
 |
0.000000000083 |
0.00000025 |
0.00000028 |
lowFe_TMEVA | 0.001040 | -0.769 |
| Thaps_hclust_0016 |
 |
 |
0.000000000083 |
0.00000025 |
0.00000028 |
exponential_vs_stationary_24light | 0.000581 | 1.18 |
| Title | Cluster Plot | Dendrogram | e-value | e-value | e-value | Condition | Condition FDR | Condition Difference |
|---|---|---|---|---|---|---|---|---|
| Thaps_hclust_0015 |
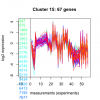 |
|
2.5e-25 |
7.4e-21 |
0.0000000011 |
exponential_vs_stationary_24light | 0.000581 | 2.9 |
| Thaps_hclust_0015 |
 |
|
2.5e-25 |
7.4e-21 |
0.0000000011 |
lowN_TMEVA | 0.001190 | -2.83 |
| Thaps_hclust_0015 |
 |
|
2.5e-25 |
7.4e-21 |
0.0000000011 |
diel_exponential_vs_stationary | 0.000602 | 1.97 |
| Thaps_hclust_0015 |
 |
|
2.5e-25 |
7.4e-21 |
0.0000000011 |
lowSi_TMEVA | 0.001350 | -2.9 |
| Thaps_hclust_0015 |
 |
|
2.5e-25 |
7.4e-21 |
0.0000000011 |
highlight_arrays | 0.000442 | -1.29 |
| Thaps_hclust_0015 |
 |
|
2.5e-25 |
7.4e-21 |
0.0000000011 |
diel_light_vs_dark | 0.000485 | -1.64 |
| Thaps_hclust_0015 |
 |
|
2.5e-25 |
7.4e-21 |
0.0000000011 |
lowFe_KTKB_Day3 | 0.000862 | 0.949 |
| Thaps_hclust_0015 |
 |
|
2.5e-25 |
7.4e-21 |
0.0000000011 |
lowFe_KTKB_Day5 | 0.249000 | 0.128 |
| Thaps_hclust_0015 |
 |
|
2.5e-25 |
7.4e-21 |
0.0000000011 |
BaP | 0.000370 | -0.519 |
| Thaps_hclust_0015 |
 |
|
2.5e-25 |
7.4e-21 |
0.0000000011 |
exponential_vs_stationary_24highlight | 0.000526 | 0.508 |
| Thaps_hclust_0015 |
 |
|
2.5e-25 |
7.4e-21 |
0.0000000011 |
co2_elevated_stat_arrays | 0.125000 | 0.239 |
| Thaps_hclust_0015 |
 |
|
2.5e-25 |
7.4e-21 |
0.0000000011 |
lowtemp_TMEVA | 0.012000 | 0.362 |
| Thaps_hclust_0015 |
 |
|
2.5e-25 |
7.4e-21 |
0.0000000011 |
highpH_TMEVA | 0.000725 | -0.331 |
| Thaps_hclust_0015 |
 |
|
2.5e-25 |
7.4e-21 |
0.0000000011 |
co2_elevated_expo_arrays | 0.250000 | 0.129 |
| Thaps_hclust_0015 |
 |
|
2.5e-25 |
7.4e-21 |
0.0000000011 |
lowFe_TMEVA | 0.001040 | -1.31 |
| Title | Cluster Plot | Dendrogram | e-value | e-value | e-value | Condition | Condition FDR | Condition Difference |
|---|---|---|---|---|---|---|---|---|
| Thaps_hclust_0014 |
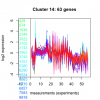 |
 |
Not available | Not available | Not available | lowFe_TMEVA | 0.001040 | -0.698 |
| Thaps_hclust_0014 |
 |
 |
Not available | Not available | Not available | exponential_vs_stationary_24light | 0.000581 | 1.39 |
| Thaps_hclust_0014 |
 |
 |
Not available | Not available | Not available | lowN_TMEVA | 0.001190 | -1.29 |
| Thaps_hclust_0014 |
 |
 |
Not available | Not available | Not available | diel_exponential_vs_stationary | 0.000602 | 0.865 |
| Thaps_hclust_0014 |
 |
 |
Not available | Not available | Not available | lowSi_TMEVA | 0.001350 | -1.3 |
| Thaps_hclust_0014 |
 |
 |
Not available | Not available | Not available | highlight_arrays | 0.000442 | -0.534 |
| Thaps_hclust_0014 |
 |
 |
Not available | Not available | Not available | diel_light_vs_dark | 0.000485 | -2.03 |
| Thaps_hclust_0014 |
 |
 |
Not available | Not available | Not available | lowFe_KTKB_Day3 | 0.000862 | 1.27 |
| Thaps_hclust_0014 |
 |
 |
Not available | Not available | Not available | lowFe_KTKB_Day5 | 0.001320 | 0.884 |
| Thaps_hclust_0014 |
 |
 |
Not available | Not available | Not available | BaP | 0.027000 | -0.257 |
