Hierarchical Clusters
Displaying 2801 - 2900 of 28001
| Title | Cluster Plot | Dendrogram | e-value | e-value | e-value | Condition | Condition FDR | Condition Difference |
|---|---|---|---|---|---|---|---|---|
| Thaps_hclust_0314 |
 |
 |
0.052 |
1.9 |
8.5 |
exponential_vs_stationary_24light | 0.614000 | -0.235 |
| Thaps_hclust_0314 |
|
|
0.052 |
1.9 |
8.5 |
lowN_TMEVA | 0.789000 | 0.115 |
| Thaps_hclust_0314 |
|
|
0.052 |
1.9 |
8.5 |
diel_exponential_vs_stationary | 0.389000 | -0.225 |
| Thaps_hclust_0314 |
|
|
0.052 |
1.9 |
8.5 |
lowSi_TMEVA | 0.758000 | 0.292 |
| Thaps_hclust_0314 |
|
|
0.052 |
1.9 |
8.5 |
highlight_arrays | 0.031900 | 0.463 |
| Title | Cluster Plot | Dendrogram | e-value | e-value | e-value | Condition | Condition FDR | Condition Difference |
|---|---|---|---|---|---|---|---|---|
| Thaps_hclust_0313 |
 |
 |
0.00000043 |
0.00014 |
0.00078 |
diel_light_vs_dark | 0.577000 | -0.141 |
| Thaps_hclust_0313 |
|
|
0.00000043 |
0.00014 |
0.00078 |
lowFe_KTKB_Day3 | 0.458000 | -0.194 |
| Thaps_hclust_0313 |
|
|
0.00000043 |
0.00014 |
0.00078 |
lowFe_KTKB_Day5 | 0.324000 | 0.206 |
| Thaps_hclust_0313 |
|
|
0.00000043 |
0.00014 |
0.00078 |
BaP | 0.000370 | 1.2 |
| Thaps_hclust_0313 |
|
|
0.00000043 |
0.00014 |
0.00078 |
exponential_vs_stationary_24highlight | 0.000526 | -0.336 |
| Thaps_hclust_0313 |
|
|
0.00000043 |
0.00014 |
0.00078 |
co2_elevated_stat_arrays | 0.548000 | 0.154 |
| Thaps_hclust_0313 |
|
|
0.00000043 |
0.00014 |
0.00078 |
lowtemp_TMEVA | 0.035900 | 0.555 |
| Thaps_hclust_0313 |
|
|
0.00000043 |
0.00014 |
0.00078 |
highpH_TMEVA | 0.656000 | -0.0852 |
| Thaps_hclust_0313 |
|
|
0.00000043 |
0.00014 |
0.00078 |
co2_elevated_expo_arrays | 0.001390 | 0.384 |
| Thaps_hclust_0313 |
|
|
0.00000043 |
0.00014 |
0.00078 |
lowFe_TMEVA | 0.144000 | -0.399 |
| Thaps_hclust_0313 |
|
|
0.00000043 |
0.00014 |
0.00078 |
exponential_vs_stationary_24light | 0.006250 | -0.815 |
| Thaps_hclust_0313 |
|
|
0.00000043 |
0.00014 |
0.00078 |
lowN_TMEVA | 0.001190 | 1.45 |
| Thaps_hclust_0313 |
|
|
0.00000043 |
0.00014 |
0.00078 |
diel_exponential_vs_stationary | 0.566000 | -0.119 |
| Thaps_hclust_0313 |
|
|
0.00000043 |
0.00014 |
0.00078 |
lowSi_TMEVA | 1.000000 | -0.039 |
| Thaps_hclust_0313 |
|
|
0.00000043 |
0.00014 |
0.00078 |
highlight_arrays | 0.007090 | 0.417 |
| Title | Cluster Plot | Dendrogram | e-value | e-value | e-value | Condition | Condition FDR | Condition Difference |
|---|---|---|---|---|---|---|---|---|
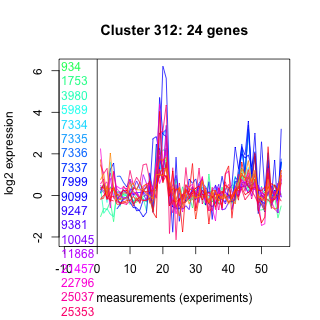
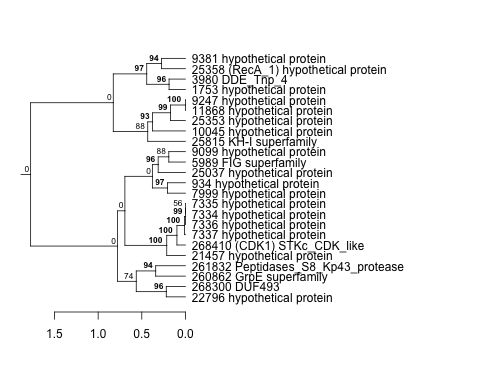
| Thaps_hclust_0312 |
 |
 |
1.6e-19 |
9.9e-16 |
0.000000000033 |
diel_light_vs_dark | 0.785000 | 0.0722 |
| Thaps_hclust_0312 |
|
|
1.6e-19 |
9.9e-16 |
0.000000000033 |
lowFe_KTKB_Day3 | 0.157000 | 0.299 |
| Thaps_hclust_0312 |
|
|
1.6e-19 |
9.9e-16 |
0.000000000033 |
lowFe_KTKB_Day5 | 0.954000 | -0.014 |
| Thaps_hclust_0312 |
|
|
1.6e-19 |
9.9e-16 |
0.000000000033 |
BaP | 0.000370 | 1.75 |
| Thaps_hclust_0312 |
|
|
1.6e-19 |
9.9e-16 |
0.000000000033 |
exponential_vs_stationary_24highlight | 0.000526 | -0.59 |
| Thaps_hclust_0312 |
|
|
1.6e-19 |
9.9e-16 |
0.000000000033 |
co2_elevated_stat_arrays | 0.002130 | 0.596 |
| Thaps_hclust_0312 |
|
|
1.6e-19 |
9.9e-16 |
0.000000000033 |
lowtemp_TMEVA | 0.385000 | 0.208 |
| Thaps_hclust_0312 |
|
|
1.6e-19 |
9.9e-16 |
0.000000000033 |
highpH_TMEVA | 0.000725 | 0.497 |
| Thaps_hclust_0312 |
|
|
1.6e-19 |
9.9e-16 |
0.000000000033 |
co2_elevated_expo_arrays | 0.660000 | 0.106 |
| Thaps_hclust_0312 |
|
|
1.6e-19 |
9.9e-16 |
0.000000000033 |
lowFe_TMEVA | 0.249000 | 0.296 |
| Thaps_hclust_0312 |
|
|
1.6e-19 |
9.9e-16 |
0.000000000033 |
exponential_vs_stationary_24light | 0.019000 | -0.641 |
| Thaps_hclust_0312 |
|
|
1.6e-19 |
9.9e-16 |
0.000000000033 |
lowN_TMEVA | 0.861000 | 0.0571 |
| Thaps_hclust_0312 |
|
|
1.6e-19 |
9.9e-16 |
0.000000000033 |
diel_exponential_vs_stationary | 0.441000 | -0.139 |
| Thaps_hclust_0312 |
|
|
1.6e-19 |
9.9e-16 |
0.000000000033 |
lowSi_TMEVA | 0.599000 | 0.334 |
| Thaps_hclust_0312 |
|
|
1.6e-19 |
9.9e-16 |
0.000000000033 |
highlight_arrays | 0.000442 | 0.559 |
| Title | Cluster Plot | Dendrogram | e-value | e-value | e-value | Condition | Condition FDR | Condition Difference |
|---|---|---|---|---|---|---|---|---|
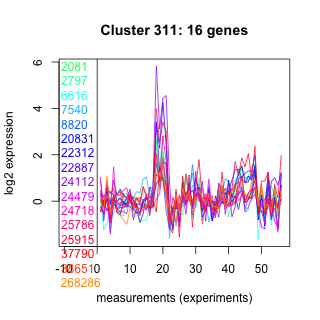
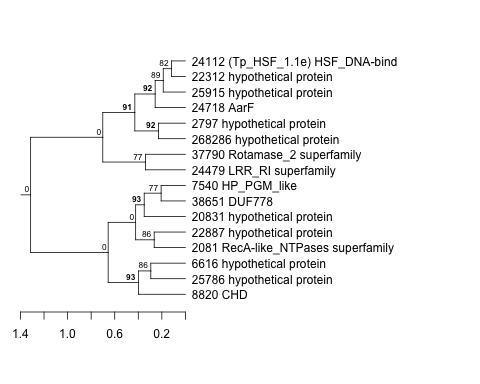
| Thaps_hclust_0311 |
 |
 |
4.1 |
0.64 |
12 |
diel_light_vs_dark | 0.685000 | -0.12 |
| Thaps_hclust_0311 |
|
|
4.1 |
0.64 |
12 |
lowFe_KTKB_Day3 | 0.864000 | -0.0564 |
| Thaps_hclust_0311 |
|
|
4.1 |
0.64 |
12 |
lowFe_KTKB_Day5 | 0.477000 | 0.168 |
| Thaps_hclust_0311 |
|
|
4.1 |
0.64 |
12 |
BaP | 0.000370 | 1.68 |
| Thaps_hclust_0311 |
|
|
4.1 |
0.64 |
12 |
exponential_vs_stationary_24highlight | 0.003230 | -0.345 |
| Thaps_hclust_0311 |
|
|
4.1 |
0.64 |
12 |
co2_elevated_stat_arrays | 0.032300 | 0.494 |
| Thaps_hclust_0311 |
|
|
4.1 |
0.64 |
12 |
lowtemp_TMEVA | 0.445000 | 0.219 |
| Thaps_hclust_0311 |
|
|
4.1 |
0.64 |
12 |
highpH_TMEVA | 0.647000 | 0.0937 |
| Thaps_hclust_0311 |
|
|
4.1 |
0.64 |
12 |
co2_elevated_expo_arrays | 0.464000 | 0.154 |
| Thaps_hclust_0311 |
|
|
4.1 |
0.64 |
12 |
lowFe_TMEVA | 0.316000 | -0.306 |
| Thaps_hclust_0311 |
|
|
4.1 |
0.64 |
12 |
exponential_vs_stationary_24light | 0.029800 | -0.737 |
| Thaps_hclust_0311 |
|
|
4.1 |
0.64 |
12 |
lowN_TMEVA | 0.469000 | 0.284 |
| Thaps_hclust_0311 |
|
|
4.1 |
0.64 |
12 |
diel_exponential_vs_stationary | 0.015400 | -0.479 |
| Thaps_hclust_0311 |
|
|
4.1 |
0.64 |
12 |
lowSi_TMEVA | 0.522000 | -0.415 |
| Thaps_hclust_0311 |
|
|
4.1 |
0.64 |
12 |
highlight_arrays | 0.000442 | 0.676 |
| Title | Cluster Plot | Dendrogram | e-value | e-value | e-value | Condition | Condition FDR | Condition Difference |
|---|---|---|---|---|---|---|---|---|
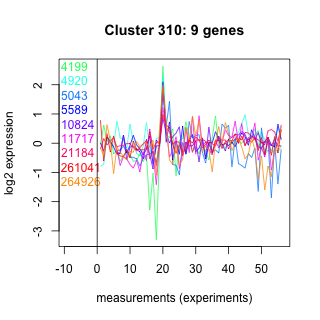
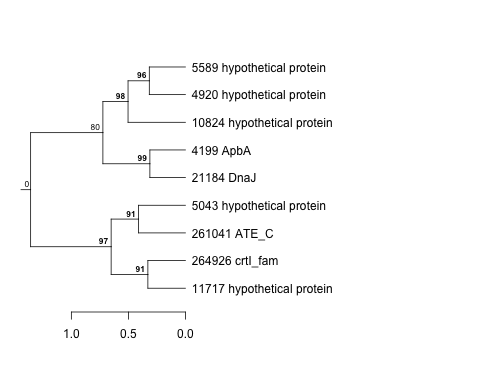
| Thaps_hclust_0310 |
 |
 |
4.9 |
19 |
86 |
diel_light_vs_dark | 0.871000 | -0.0732 |
| Thaps_hclust_0310 |
|
|
4.9 |
19 |
86 |
lowFe_KTKB_Day3 | 0.412000 | -0.305 |
| Thaps_hclust_0310 |
|
|
4.9 |
19 |
86 |
lowFe_KTKB_Day5 | 0.115000 | -0.481 |
| Thaps_hclust_0310 |
|
|
4.9 |
19 |
86 |
BaP | 0.254000 | 0.376 |
| Thaps_hclust_0310 |
|
|
4.9 |
19 |
86 |
exponential_vs_stationary_24highlight | 0.521000 | -0.106 |
| Thaps_hclust_0310 |
|
|
4.9 |
19 |
86 |
co2_elevated_stat_arrays | 0.802000 | 0.084 |
| Thaps_hclust_0310 |
|
|
4.9 |
19 |
86 |
lowtemp_TMEVA | 0.596000 | -0.204 |
| Thaps_hclust_0310 |
|
|
4.9 |
19 |
86 |
highpH_TMEVA | 0.807000 | -0.0669 |
| Thaps_hclust_0310 |
|
|
4.9 |
19 |
86 |
co2_elevated_expo_arrays | 0.600000 | 0.15 |
| Thaps_hclust_0310 |
|
|
4.9 |
19 |
86 |
lowFe_TMEVA | 0.611000 | -0.205 |
| Thaps_hclust_0310 |
|
|
4.9 |
19 |
86 |
exponential_vs_stationary_24light | 0.391000 | -0.39 |
| Thaps_hclust_0310 |
|
|
4.9 |
19 |
86 |
lowN_TMEVA | 0.615000 | 0.229 |
| Thaps_hclust_0310 |
|
|
4.9 |
19 |
86 |
diel_exponential_vs_stationary | 0.437000 | -0.22 |
| Thaps_hclust_0310 |
|
|
4.9 |
19 |
86 |
lowSi_TMEVA | 1.000000 | 0.0292 |
| Thaps_hclust_0310 |
|
|
4.9 |
19 |
86 |
highlight_arrays | 0.337000 | 0.229 |
| Title | Cluster Plot | Dendrogram | e-value | e-value | e-value | Condition | Condition FDR | Condition Difference |
|---|---|---|---|---|---|---|---|---|
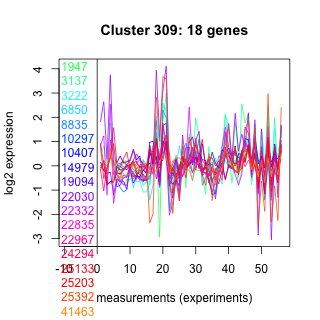
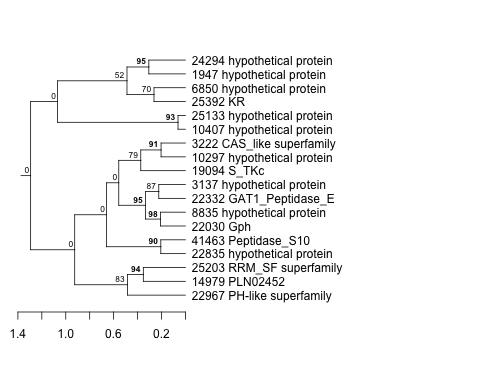
| Thaps_hclust_0309 |
 |
 |
0.0000055 |
0.015 |
1.1 |
diel_light_vs_dark | 0.785000 | -0.0842 |
| Thaps_hclust_0309 |
|
|
0.0000055 |
0.015 |
1.1 |
lowFe_KTKB_Day3 | 0.605000 | -0.142 |
| Thaps_hclust_0309 |
|
|
0.0000055 |
0.015 |
1.1 |
lowFe_KTKB_Day5 | 0.629000 | 0.112 |
| Thaps_hclust_0309 |
|
|
0.0000055 |
0.015 |
1.1 |
BaP | 0.000370 | 0.971 |
| Thaps_hclust_0309 |
|
|
0.0000055 |
0.015 |
1.1 |
exponential_vs_stationary_24highlight | 0.000526 | -0.523 |
| Thaps_hclust_0309 |
|
|
0.0000055 |
0.015 |
1.1 |
co2_elevated_stat_arrays | 0.198000 | 0.3 |
| Thaps_hclust_0309 |
|
|
0.0000055 |
0.015 |
1.1 |
lowtemp_TMEVA | 0.573000 | -0.161 |
| Thaps_hclust_0309 |
|
|
0.0000055 |
0.015 |
1.1 |
highpH_TMEVA | 0.005910 | 0.485 |
| Thaps_hclust_0309 |
|
|
0.0000055 |
0.015 |
1.1 |
co2_elevated_expo_arrays | 0.443000 | -0.152 |
| Thaps_hclust_0309 |
|
|
0.0000055 |
0.015 |
1.1 |
lowFe_TMEVA | 0.309000 | 0.297 |
| Thaps_hclust_0309 |
|
|
0.0000055 |
0.015 |
1.1 |
exponential_vs_stationary_24light | 0.000581 | -1.43 |
| Thaps_hclust_0309 |
|
|
0.0000055 |
0.015 |
1.1 |
lowN_TMEVA | 0.347000 | -0.332 |
| Thaps_hclust_0309 |
|
|
0.0000055 |
0.015 |
1.1 |
diel_exponential_vs_stationary | 0.001600 | -0.6 |
| Thaps_hclust_0309 |
|
|
0.0000055 |
0.015 |
1.1 |
lowSi_TMEVA | 0.046100 | 0.843 |
| Thaps_hclust_0309 |
|
|
0.0000055 |
0.015 |
1.1 |
highlight_arrays | 0.029800 | 0.353 |
| Title | Cluster Plot | Dendrogram | e-value | e-value | e-value | Condition | Condition FDR | Condition Difference |
|---|---|---|---|---|---|---|---|---|
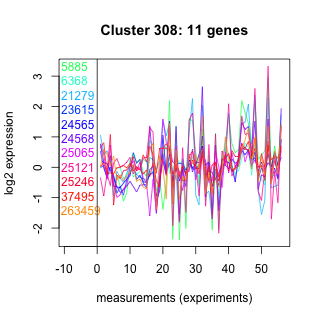
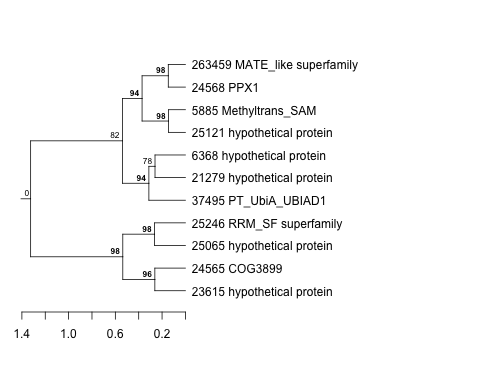
| Thaps_hclust_0308 |
 |
 |
0.37 |
17 |
1.6 |
diel_light_vs_dark | 0.003750 | -0.804 |
| Thaps_hclust_0308 |
|
|
0.37 |
17 |
1.6 |
lowFe_KTKB_Day3 | 0.458000 | 0.246 |
| Thaps_hclust_0308 |
|
|
0.37 |
17 |
1.6 |
lowFe_KTKB_Day5 | 0.325000 | 0.265 |
| Thaps_hclust_0308 |
|
|
0.37 |
17 |
1.6 |
BaP | 0.703000 | -0.124 |
| Thaps_hclust_0308 |
|
|
0.37 |
17 |
1.6 |
exponential_vs_stationary_24highlight | 0.006110 | -0.416 |
| Thaps_hclust_0308 |
|
|
0.37 |
17 |
1.6 |
co2_elevated_stat_arrays | 0.000658 | 0.927 |
| Thaps_hclust_0308 |
|
|
0.37 |
17 |
1.6 |
lowtemp_TMEVA | 0.243000 | -0.403 |
| Thaps_hclust_0308 |
|
|
0.37 |
17 |
1.6 |
highpH_TMEVA | 0.072300 | 0.375 |
| Thaps_hclust_0308 |
|
|
0.37 |
17 |
1.6 |
co2_elevated_expo_arrays | 0.802000 | -0.0941 |
| Thaps_hclust_0308 |
|
|
0.37 |
17 |
1.6 |
lowFe_TMEVA | 0.622000 | 0.185 |
| Thaps_hclust_0308 |
|
|
0.37 |
17 |
1.6 |
exponential_vs_stationary_24light | 0.019700 | -0.931 |
| Thaps_hclust_0308 |
|
|
0.37 |
17 |
1.6 |
lowN_TMEVA | 0.861000 | -0.0666 |
| Thaps_hclust_0308 |
|
|
0.37 |
17 |
1.6 |
diel_exponential_vs_stationary | 0.679000 | -0.113 |
| Thaps_hclust_0308 |
|
|
0.37 |
17 |
1.6 |
lowSi_TMEVA | 0.911000 | 0.178 |
| Thaps_hclust_0308 |
|
|
0.37 |
17 |
1.6 |
highlight_arrays | 0.045100 | 0.419 |
| Title | Cluster Plot | Dendrogram | e-value | e-value | e-value | Condition | Condition FDR | Condition Difference |
|---|---|---|---|---|---|---|---|---|
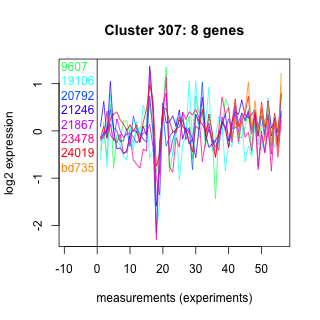
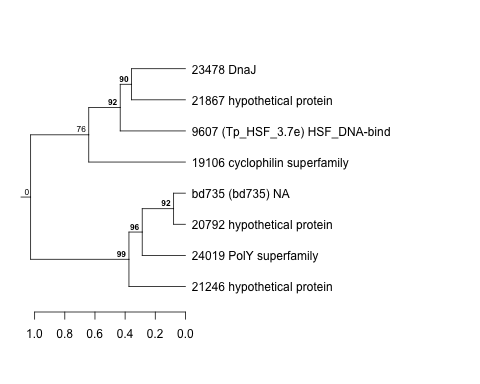
| Thaps_hclust_0307 |
 |
 |
46 |
50 |
580 |
diel_light_vs_dark | 0.703000 | -0.152 |
| Thaps_hclust_0307 |
|
|
46 |
50 |
580 |
lowFe_KTKB_Day3 | 0.087300 | 0.649 |
| Thaps_hclust_0307 |
|
|
46 |
50 |
580 |
lowFe_KTKB_Day5 | 0.787000 | 0.0945 |
| Thaps_hclust_0307 |
|
|
46 |
50 |
580 |
BaP | 0.383000 | -0.309 |
| Thaps_hclust_0307 |
|
|
46 |
50 |
580 |
exponential_vs_stationary_24highlight | 0.025800 | -0.38 |