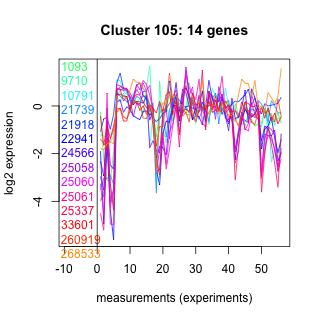
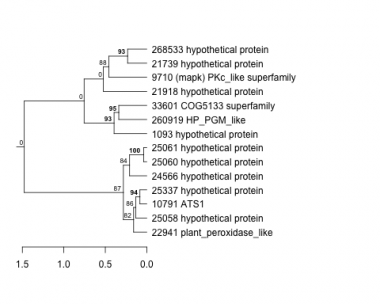
Thaps_hclust_0105 Hierarchical Clustering
Thalassiosira pseudonana
| GO ID | Go Term | p-value | q-value | Cluster |
|---|---|---|---|---|
| GO:0006979 | response to oxidative stress | 0.0197059 | 1 | Thaps_hclust_0105 |
| GO:0006306 | DNA methylation | 0.0237743 | 1 | Thaps_hclust_0105 |
| GO:0006468 | protein amino acid phosphorylation | 0.164893 | 1 | Thaps_hclust_0105 |
| GO:0008152 | metabolism | 0.296505 | 1 | Thaps_hclust_0105 |
|
1093 : hypothetical protein |
21918 : hypothetical protein |
25060 : hypothetical protein |
33601 : COG5133 superfamily |
|
9710 : (mapk) PKc_like superfamily |
22941 : plant_peroxidase_like |
25061 : hypothetical protein |
260919 : HP_PGM_like |
|
10791 : ATS1 |
24566 : hypothetical protein |
25337 : hypothetical protein |
268533 : hypothetical protein |
|
21739 : hypothetical protein |
25058 : hypothetical protein |
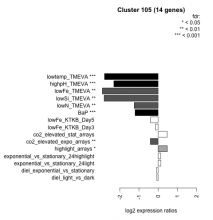
| Condition | Condition | Difference | FDR |
|---|---|---|---|
| diel_light_vs_dark | diel_light_vs_dark | -0.071 | 0.836 |
| lowFe_KTKB_Day3 | lowFe_KTKB_Day3 | -0.134 | 0.682 |
| lowFe_KTKB_Day5 | lowFe_KTKB_Day5 | -0.396 | 0.106 |
| BaP | BaP | -1.200 | 0.00037 |
| exponential_vs_stationary_24highlight | exponential_vs_stationary_24highlight | 0.124 | 0.349 |
| co2_elevated_stat_arrays | co2_elevated_stat_arrays | 0.476 | 0.0516 |
| lowtemp_TMEVA | lowtemp_TMEVA | -2.800 | 0.000735 |
| highpH_TMEVA | highpH_TMEVA | -2.310 | 0.000725 |
| co2_elevated_expo_arrays | co2_elevated_expo_arrays | -0.404 | 0.00918 |
| lowFe_TMEVA | lowFe_TMEVA | -2.920 | 0.00104 |
| exponential_vs_stationary_24light | exponential_vs_stationary_24light | 0.145 | 0.754 |
| lowN_TMEVA | lowN_TMEVA | -1.250 | 0.00119 |
| diel_exponential_vs_stationary | diel_exponential_vs_stationary | -0.082 | 0.752 |
| lowSi_TMEVA | lowSi_TMEVA | -2.820 | 0.00135 |
| highlight_arrays | highlight_arrays | 0.481 | 0.0104 |


