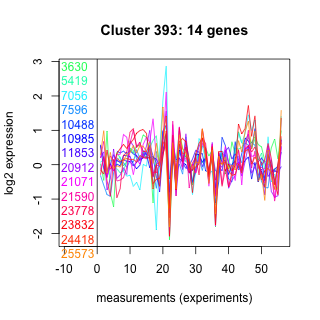
Thaps_hclust_0393 Hierarchical Clustering
Thalassiosira pseudonana
| GO ID | Go Term | p-value | q-value | Cluster |
|---|---|---|---|---|
| GO:0006629 | lipid metabolism | 0.0412459 | 1 | Thaps_hclust_0393 |
| GO:0006512 | ubiquitin cycle | 0.0509804 | 1 | Thaps_hclust_0393 |
| GO:0006355 | regulation of transcription, DNA-dependent | 0.0681942 | 1 | Thaps_hclust_0393 |
| GO:0006464 | protein modification | 0.0823711 | 1 | Thaps_hclust_0393 |
| GO:0006457 | protein folding | 0.173725 | 1 | Thaps_hclust_0393 |
| GO:0006118 | electron transport | 0.327122 | 1 | Thaps_hclust_0393 |
|
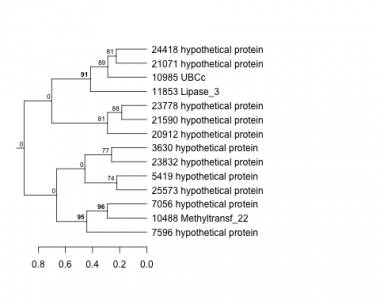
3630 : hypothetical protein |
10488 : Methyltransf_22 |
21071 : hypothetical protein |
23832 : hypothetical protein |
|
5419 : hypothetical protein |
10985 : UBCc |
21590 : hypothetical protein |
24418 : hypothetical protein |
|
7056 : hypothetical protein |
11853 : Lipase_3 |
23778 : hypothetical protein |
25573 : hypothetical protein |
|
7596 : hypothetical protein |
20912 : hypothetical protein |
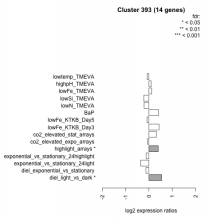
| Condition | Condition | Difference | FDR |
|---|---|---|---|
| diel_light_vs_dark | diel_light_vs_dark | 0.549 | 0.0195 |
| lowFe_KTKB_Day3 | lowFe_KTKB_Day3 | 0.435 | 0.118 |
| lowFe_KTKB_Day5 | lowFe_KTKB_Day5 | -0.080 | 0.767 |
| BaP | BaP | 0.414 | 0.0993 |
| exponential_vs_stationary_24highlight | exponential_vs_stationary_24highlight | -0.119 | 0.374 |
| co2_elevated_stat_arrays | co2_elevated_stat_arrays | 0.319 | 0.209 |
| lowtemp_TMEVA | lowtemp_TMEVA | -0.075 | 0.825 |
| highpH_TMEVA | highpH_TMEVA | 0.094 | 0.664 |
| co2_elevated_expo_arrays | co2_elevated_expo_arrays | -0.054 | 0.911 |
| lowFe_TMEVA | lowFe_TMEVA | 0.119 | 0.776 |
| exponential_vs_stationary_24light | exponential_vs_stationary_24light | -0.354 | 0.346 |
| lowN_TMEVA | lowN_TMEVA | -0.208 | 0.608 |
| diel_exponential_vs_stationary | diel_exponential_vs_stationary | -0.127 | 0.597 |
| lowSi_TMEVA | lowSi_TMEVA | -0.218 | 0.844 |
| highlight_arrays | highlight_arrays | 0.404 | 0.0273 |


