Hierarchical Clusters
Displaying 401 - 500 of 7500
| Title | Cluster Plot | Dendrogram | e-value | e-value | e-value | Condition | Condition FDR | Condition Difference |
|---|---|---|---|---|---|---|---|---|
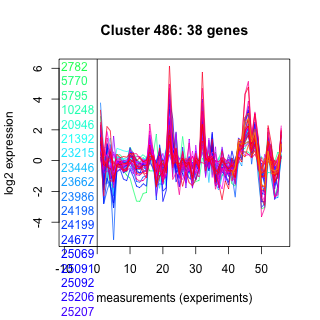
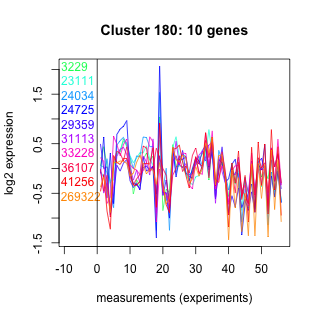
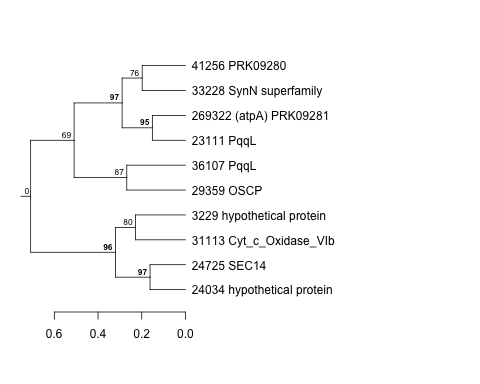
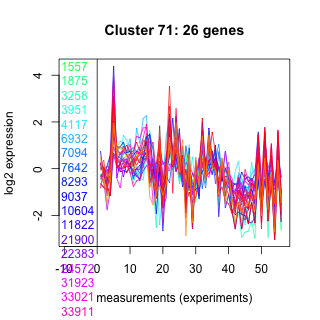
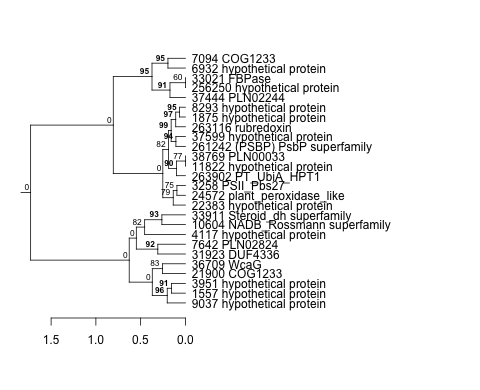
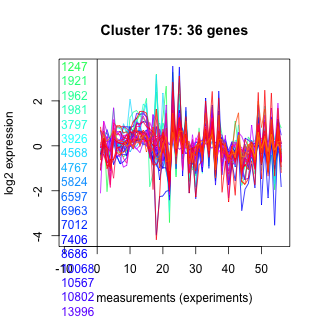
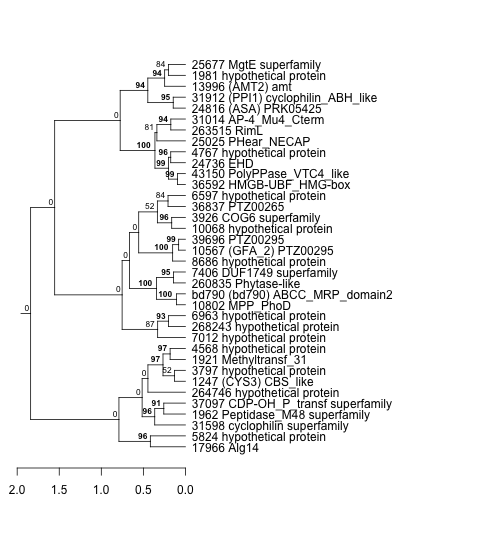
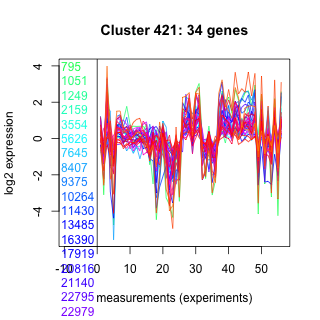
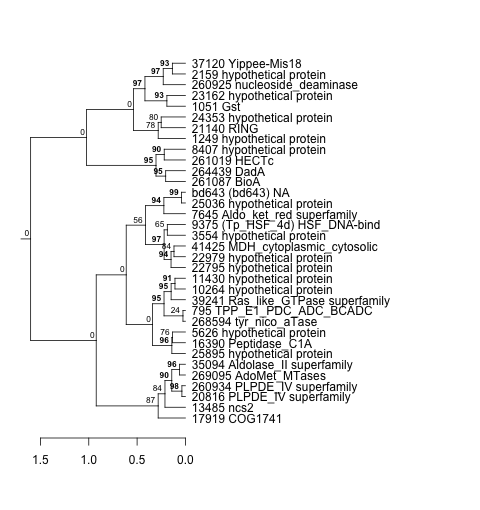
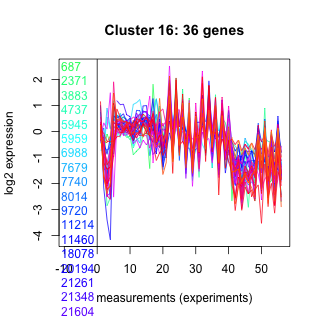
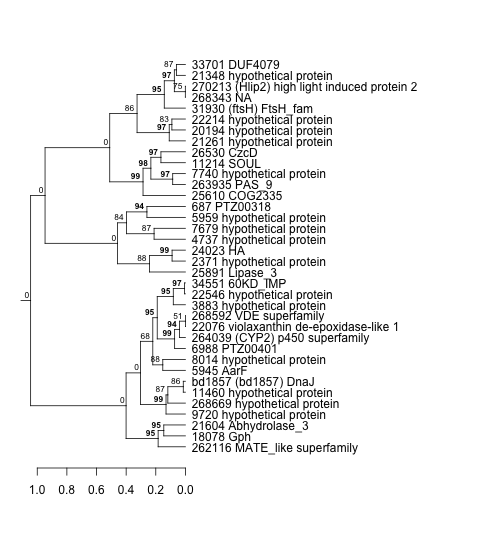
| Thaps_hclust_0486 |
 |
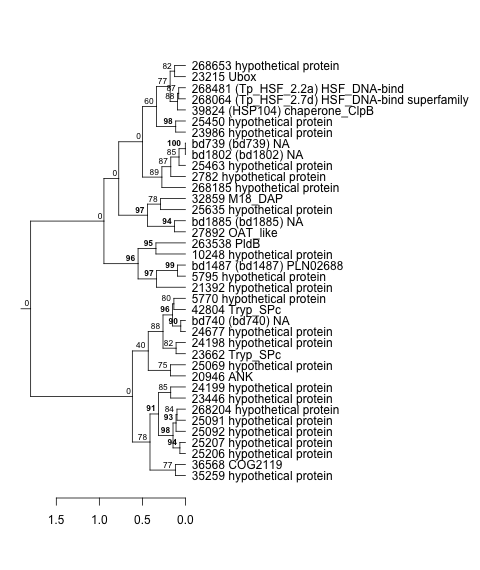 |
0.000000043 |
0.044 |
0.047 |
exponential_vs_stationary_24highlight | 0.000526 | -0.32 |
| Title | Cluster Plot | Dendrogram | e-value | e-value | e-value | Condition | Condition FDR | Condition Difference |
|---|---|---|---|---|---|---|---|---|
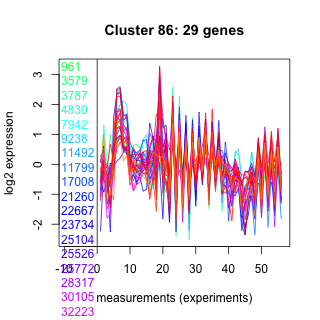
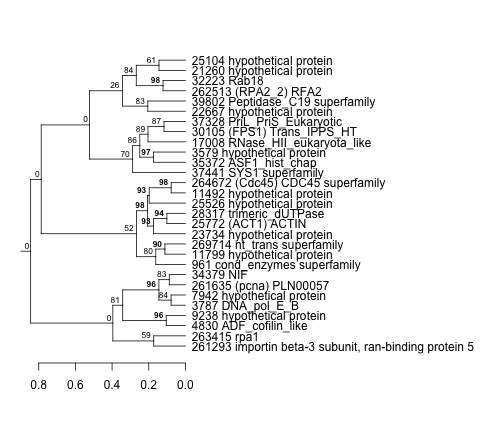
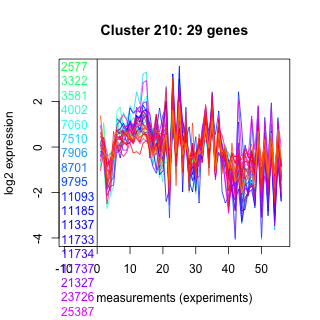
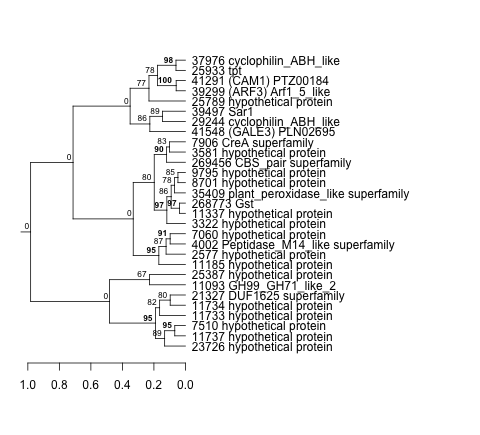
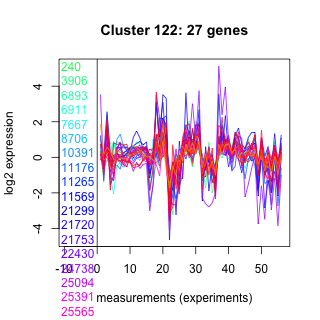
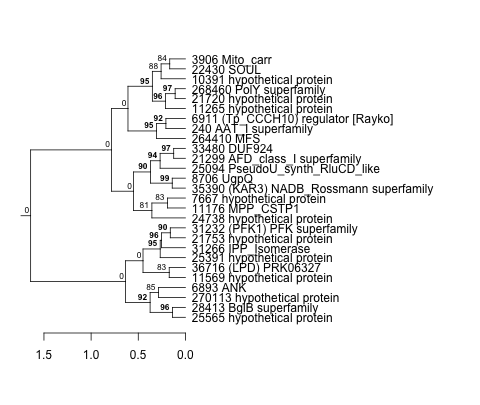
| Thaps_hclust_0063 |
 |
 |
9.8e-19 |
5.7e-17 |
8.2e-17 |
exponential_vs_stationary_24highlight | 0.000526 | 0.445 |
| Title | Cluster Plot | Dendrogram | e-value | e-value | e-value | Condition | Condition FDR | Condition Difference |
|---|---|---|---|---|---|---|---|---|
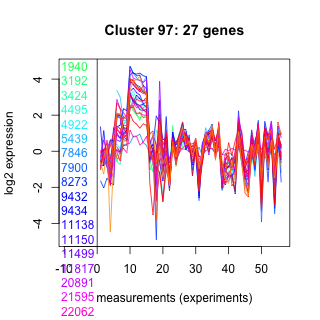
| Thaps_hclust_0097 |
 |
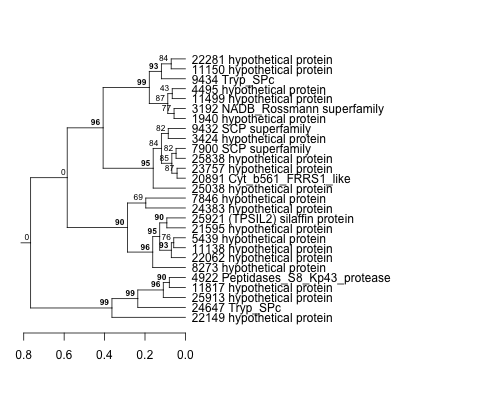 |
0.02 |
1.4 |
3.4 |
exponential_vs_stationary_24highlight | 0.000526 | 0.461 |
| Title | Cluster Plot | Dendrogram | e-value | e-value | e-value | Condition | Condition FDR | Condition Difference |
|---|---|---|---|---|---|---|---|---|
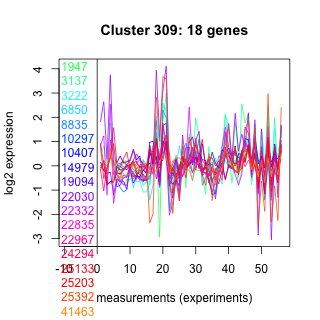
| Thaps_hclust_0309 |
 |
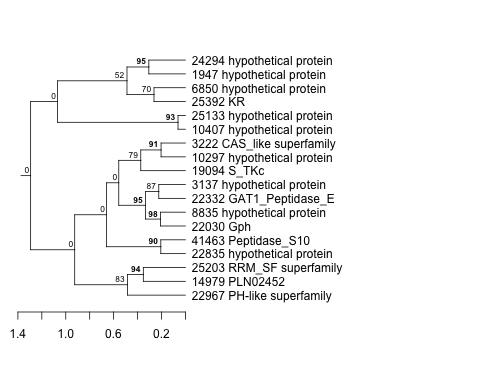 |
0.0000055 |
0.015 |
1.1 |
exponential_vs_stationary_24highlight | 0.000526 | -0.523 |
| Title | Cluster Plot | Dendrogram | e-value | e-value | e-value | Condition | Condition FDR | Condition Difference |
|---|---|---|---|---|---|---|---|---|
| Thaps_hclust_0009 |
 |
 |
0.0000023 |
0.0000027 |
0.000035 |
exponential_vs_stationary_24highlight | 0.000526 | 0.272 |
| Title | Cluster Plot | Dendrogram | e-value | e-value | e-value | Condition | Condition FDR | Condition Difference |
|---|---|---|---|---|---|---|---|---|
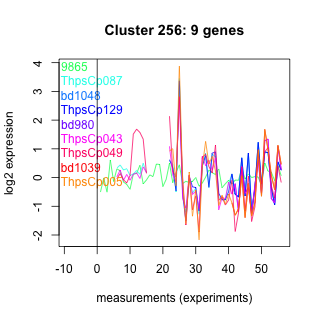
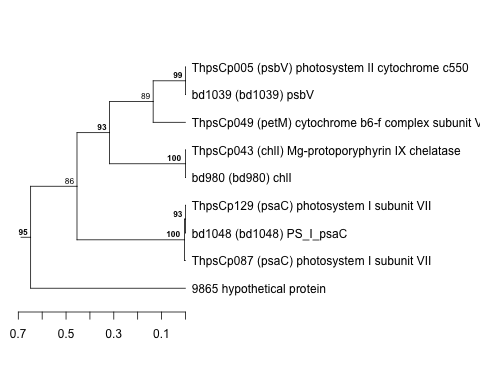
| Thaps_hclust_0256 |
 |
 |
0.0000000000016 |
0.0000000000033 |
0.0000000000017 |
exponential_vs_stationary_24highlight | 0.000526 | -0.614 |
| Title | Cluster Plot | Dendrogram | e-value | e-value | e-value | Condition | Condition FDR | Condition Difference |
|---|---|---|---|---|---|---|---|---|
| Thaps_hclust_0485 |
 |
 |
0.0012 |
0.0078 |
0.16 |
exponential_vs_stationary_24highlight | 0.000526 | -0.27 |
| Title | Cluster Plot | Dendrogram | e-value | e-value | e-value | Condition | Condition FDR | Condition Difference |
|---|---|---|---|---|---|---|---|---|
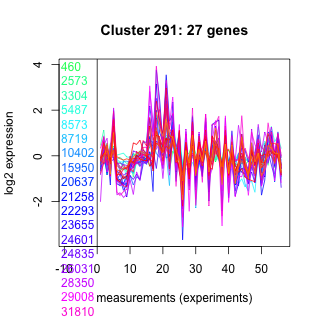
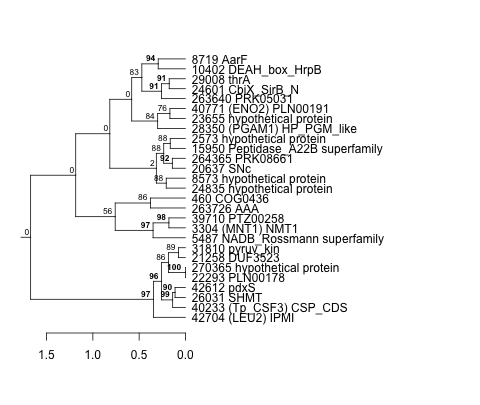
| Thaps_hclust_0291 |
 |
 |
0.000000049 |
0.000056 |
0.0000035 |
exponential_vs_stationary_24highlight | 0.000526 | 0.332 |
| Title | Cluster Plot | Dendrogram | e-value | e-value | e-value | Condition | Condition FDR | Condition Difference |
|---|---|---|---|---|---|---|---|---|
| Thaps_hclust_0326 |
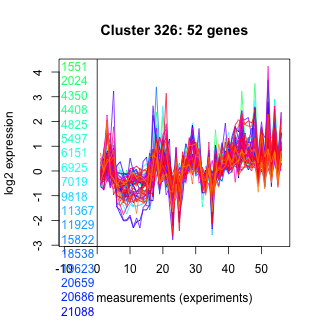 |
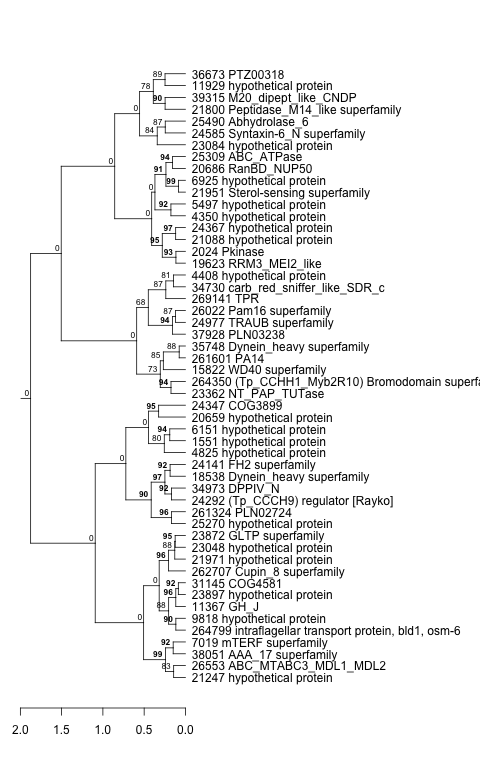 |
0.000000000000042 |
0.00000000011 |
0.00000051 |
exponential_vs_stationary_24highlight | 0.000526 | -0.363 |
| Title | Cluster Plot | Dendrogram | e-value | e-value | e-value | Condition | Condition FDR | Condition Difference |
|---|---|---|---|---|---|---|---|---|
| Thaps_hclust_0361 |
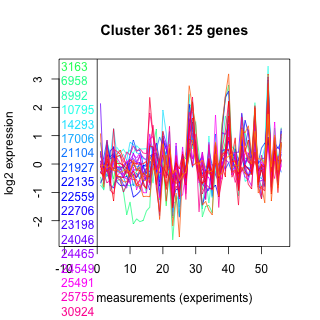 |
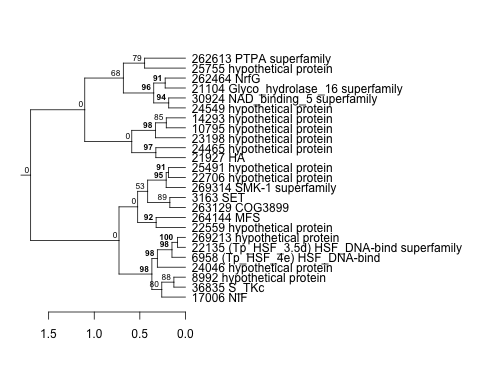 |
0.00000000081 |
0.14 |
2.1 |
exponential_vs_stationary_24highlight | 0.000526 | -0.589 |
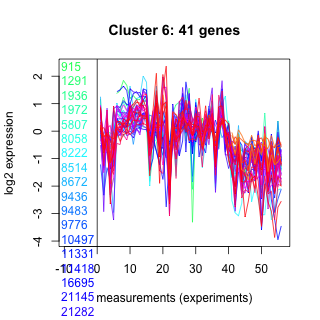
| Title | Cluster Plot | Dendrogram | e-value | e-value | e-value | Condition | Condition FDR | Condition Difference |
|---|---|---|---|---|---|---|---|---|
| Thaps_hclust_0061 |
 |
 |
0.000000062 |
0.00063 |
0.032 |
exponential_vs_stationary_24highlight | 0.000526 | 0.898 |
| Title | Cluster Plot | Dendrogram | e-value | e-value | e-value | Condition | Condition FDR | Condition Difference |
|---|---|---|---|---|---|---|---|---|
| Thaps_hclust_0360 |
 |
 |
0.0000000013 |
0.0000000052 |
0.0000016 |
exponential_vs_stationary_24highlight | 0.000526 | -1.24 |
| Title | Cluster Plot | Dendrogram | e-value | e-value | e-value | Condition | Condition FDR | Condition Difference |
|---|---|---|---|---|---|---|---|---|
| Thaps_hclust_0483 |
 |
 |
0.7 |
5 |
0.096 |
exponential_vs_stationary_24highlight | 0.000526 | -0.365 |
| Title | Cluster Plot | Dendrogram | e-value | e-value | e-value | Condition | Condition FDR | Condition Difference |
|---|---|---|---|---|---|---|---|---|
| Thaps_hclust_0007 |
 |
 |
0.0000000001 |
0.0000000097 |
0.000027 |
exponential_vs_stationary_24highlight | 0.000526 | 0.291 |
| Title | Cluster Plot | Dendrogram | e-value | e-value | e-value | Condition | Condition FDR | Condition Difference |
|---|---|---|---|---|---|---|---|---|
| Thaps_hclust_0219 |
 |
 |
2.8e-16 |
0.0000000055 |
0.012 |
exponential_vs_stationary_24highlight | 0.000526 | -0.255 |
| Title | Cluster Plot | Dendrogram | e-value | e-value | e-value | Condition | Condition FDR | Condition Difference |
|---|---|---|---|---|---|---|---|---|
| Thaps_hclust_0482 |
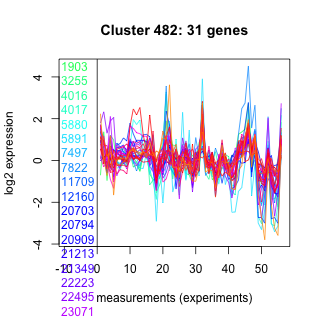 |
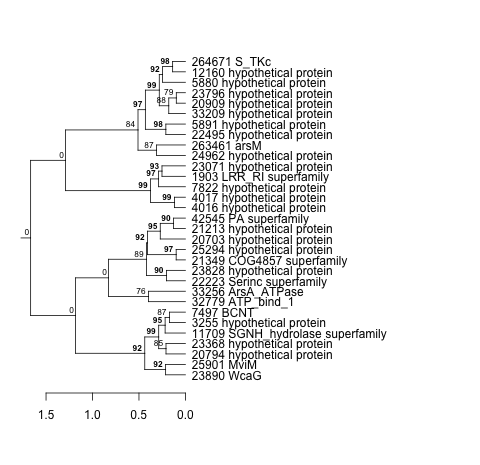 |
0.29 |
0.69 |
2.1 |
exponential_vs_stationary_24highlight | 0.000526 | -0.495 |
| Title | Cluster Plot | Dendrogram | e-value | e-value | e-value | Condition | Condition FDR | Condition Difference |
|---|---|---|---|---|---|---|---|---|
| Thaps_hclust_0059 |
 |
 |
0.0000000000000026 |
0.000000000024 |
0.0000014 |
exponential_vs_stationary_24highlight | 0.000526 | 0.388 |
| Title | Cluster Plot | Dendrogram | e-value | e-value | e-value | Condition | Condition FDR | Condition Difference |
|---|---|---|---|---|---|---|---|---|
| Thaps_hclust_0306 |
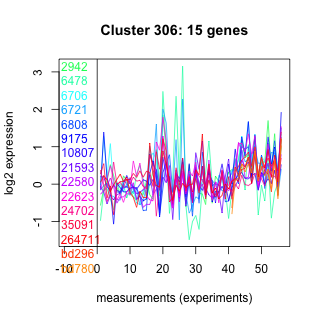 |
 |
0.001 |
0.26 |
5.3 |
exponential_vs_stationary_24highlight | 0.000526 | -0.436 |
| Title | Cluster Plot | Dendrogram | e-value | e-value | e-value | Condition | Condition FDR | Condition Difference |
|---|---|---|---|---|---|---|---|---|
| Thaps_hclust_0006 |
 |
 |
0.0000000000025 |
0.000000092 |
0.000086 |
exponential_vs_stationary_24highlight | 0.000526 | 0.389 |
| Title | Cluster Plot | Dendrogram | e-value | e-value | e-value | Condition | Condition FDR | Condition Difference |
|---|---|---|---|---|---|---|---|---|
| Thaps_hclust_0024 |
 |
|
2.8e-19 |
1.2e-20 |
0.00000000000043 |
exponential_vs_stationary_24highlight | 0.000526 | 0.184 |
| Title | Cluster Plot | Dendrogram | e-value | e-value | e-value | Condition | Condition FDR | Condition Difference |
|---|---|---|---|---|---|---|---|---|
| Thaps_hclust_0058 |
 |
 |
0.000000037 |
0.000000014 |
0.00000069 |
exponential_vs_stationary_24highlight | 0.000526 | 0.403 |
| Thaps_hclust_0058 |
|
|
0.000000037 |
0.000000014 |
0.00000069 |
exponential_vs_stationary_24light | 0.000581 | 2.2 |
| Title | Cluster Plot | Dendrogram | e-value | e-value | e-value | Condition | Condition FDR | Condition Difference |
|---|---|---|---|---|---|---|---|---|
| Thaps_hclust_0022 |
 |
|
1.9e-31 |
2.4e-22 |
6.4e-20 |
exponential_vs_stationary_24highlight | 0.000526 | 0.356 |
| Thaps_hclust_0022 |
|
|
1.9e-31 |
2.4e-22 |
6.4e-20 |
exponential_vs_stationary_24light | 0.000581 | 3.47 |
| Title | Cluster Plot | Dendrogram | e-value | e-value | e-value | Condition | Condition FDR | Condition Difference |
|---|---|---|---|---|---|---|---|---|
| Thaps_hclust_0023 |
 |
 |
0.000000000039 |
0.0000072 |
0.002 |
exponential_vs_stationary_24highlight | 0.000526 | 0.399 |
| Thaps_hclust_0023 |
|
|
0.000000000039 |
0.0000072 |
0.002 |
exponential_vs_stationary_24light | 0.000581 | 1.5 |
| Title | Cluster Plot | Dendrogram | e-value | e-value | e-value | Condition | Condition FDR | Condition Difference |
|---|---|---|---|---|---|---|---|---|
| Thaps_hclust_0040 |
 |
 |
1.8e-29 |
0.000000000042 |
0.00000000063 |
exponential_vs_stationary_24highlight | 0.000526 | 0.348 |
| Title | Cluster Plot | Dendrogram | e-value | e-value | e-value | Condition | Condition FDR | Condition Difference |
|---|---|---|---|---|---|---|---|---|
| Thaps_hclust_0481 |
 |
 |
0.000000069 |
0.00000053 |
0.000012 |
exponential_vs_stationary_24highlight | 0.000526 | -0.506 |
| Thaps_hclust_0481 |
|
|
0.000000069 |
0.00000053 |
0.000012 |
exponential_vs_stationary_24light | 0.000581 | -1.03 |
| Title | Cluster Plot | Dendrogram | e-value | e-value | e-value | Condition | Condition FDR | Condition Difference |
|---|---|---|---|---|---|---|---|---|
| Thaps_hclust_0392 |
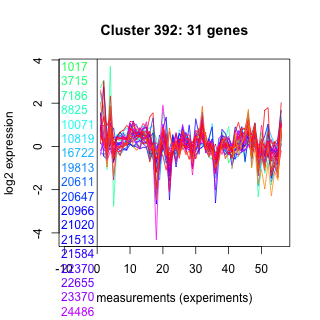 |
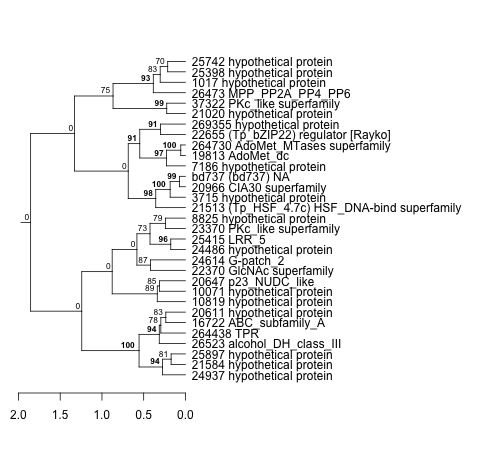 |
0.00055 |
0.0027 |
0.19 |
exponential_vs_stationary_24highlight | 0.000526 | -0.39 |
| Title | Cluster Plot | Dendrogram | e-value | e-value | e-value | Condition | Condition FDR | Condition Difference |
|---|---|---|---|---|---|---|---|---|
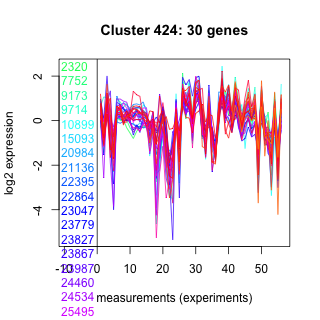
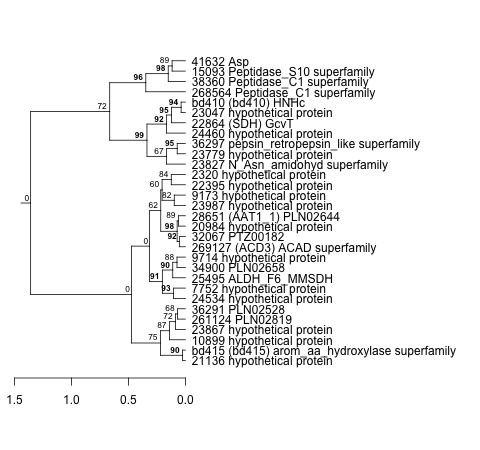
| Thaps_hclust_0427 |
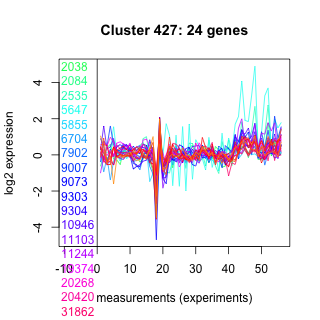 |
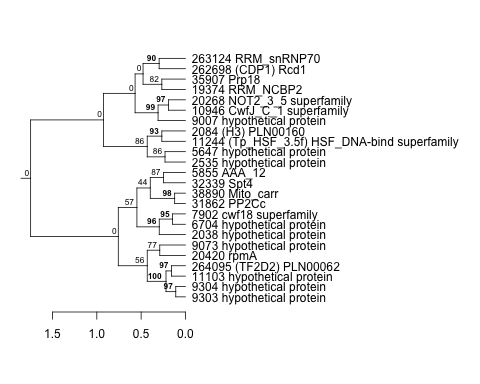 |
0.0000022 |
8.8 |
40 |
exponential_vs_stationary_24highlight | 0.000526 | -0.383 |
| Title | Cluster Plot | Dendrogram | e-value | e-value | e-value | Condition | Condition FDR | Condition Difference |
|---|---|---|---|---|---|---|---|---|
| Thaps_hclust_0021 |
 |
 |
0.00000000002 |
0.0000088 |
0.0012 |
exponential_vs_stationary_24highlight | 0.000526 | 0.297 |
| Thaps_hclust_0021 |
|
|
0.00000000002 |
0.0000088 |
0.0012 |
exponential_vs_stationary_24light | 0.000581 | 0.728 |
| Title | Cluster Plot | Dendrogram | e-value | e-value | e-value | Condition | Condition FDR | Condition Difference |
|---|---|---|---|---|---|---|---|---|
| Thaps_hclust_0462 |
 |
 |
0.0000000094 |
0.0000011 |
0.000046 |
exponential_vs_stationary_24highlight | 0.000526 | 0.504 |
| Title | Cluster Plot | Dendrogram | e-value | e-value | e-value | Condition | Condition FDR | Condition Difference |
|---|---|---|---|---|---|---|---|---|
| Thaps_hclust_0039 |
 |
 |
2.2e-16 |
0.000000000000049 |
0.00083 |
exponential_vs_stationary_24highlight | 0.000526 | 0.296 |
| Title | Cluster Plot | Dendrogram | e-value | e-value | e-value | Condition | Condition FDR | Condition Difference |
|---|---|---|---|---|---|---|---|---|
| Thaps_hclust_0180 |
 |
 |
1.5 |
1.7 |
12 |
exponential_vs_stationary_24highlight | 0.000526 | 0.546 |
| Title | Cluster Plot | Dendrogram | e-value | e-value | e-value | Condition | Condition FDR | Condition Difference |
|---|---|---|---|---|---|---|---|---|
| Thaps_hclust_0302 |
 |
 |
0.000000015 |
0.00000024 |
0.00000000039 |
exponential_vs_stationary_24highlight | 0.000526 | -0.464 |
| Thaps_hclust_0302 |
|
|
0.000000015 |
0.00000024 |
0.00000000039 |
exponential_vs_stationary_24light | 0.000581 | -1.45 |
| Title | Cluster Plot | Dendrogram | e-value | e-value | e-value | Condition | Condition FDR | Condition Difference |
|---|---|---|---|---|---|---|---|---|
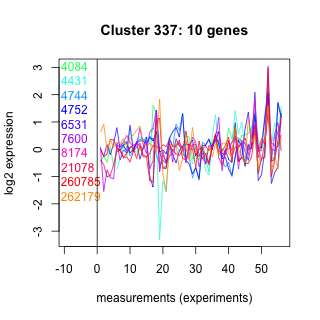
| Thaps_hclust_0337 |
 |
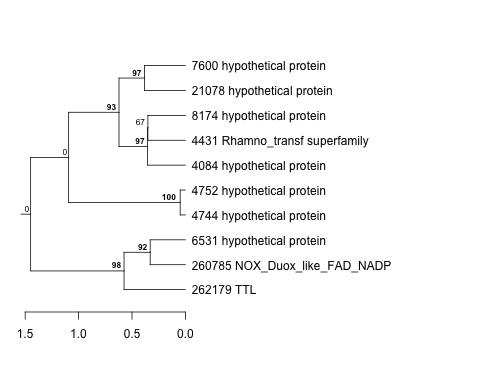 |
3.5 |
3 |
280 |
exponential_vs_stationary_24highlight | 0.000526 | -0.534 |
| Title | Cluster Plot | Dendrogram | e-value | e-value | e-value | Condition | Condition FDR | Condition Difference |
|---|---|---|---|---|---|---|---|---|
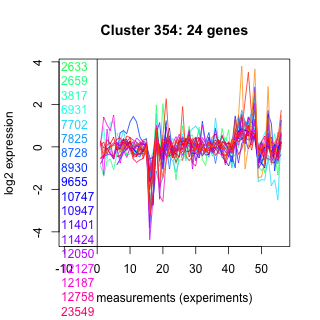
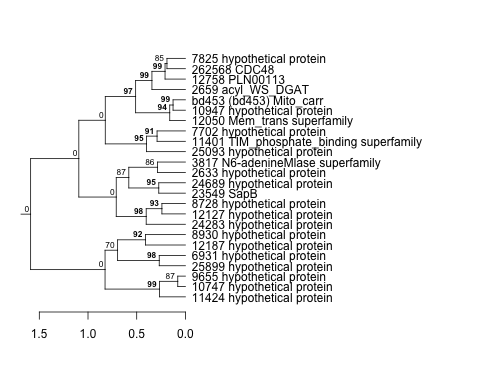
| Thaps_hclust_0354 |
 |
 |
0.027 |
0.032 |
0.78 |
exponential_vs_stationary_24highlight | 0.000526 | -0.451 |
| Title | Cluster Plot | Dendrogram | e-value | e-value | e-value | Condition | Condition FDR | Condition Difference |
|---|---|---|---|---|---|---|---|---|
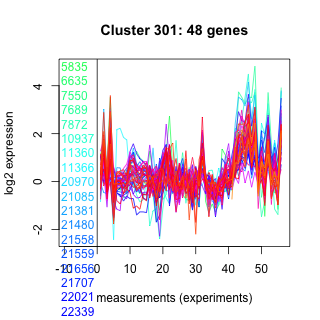
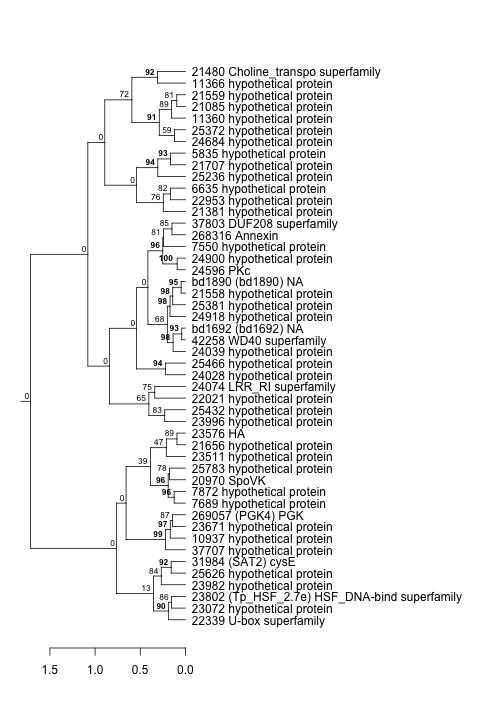
| Thaps_hclust_0301 |
 |
 |
0.000000022 |
0.82 |
2.1 |
exponential_vs_stationary_24highlight | 0.000526 | -0.594 |
| Thaps_hclust_0301 |
|
|
0.000000022 |
0.82 |
2.1 |
exponential_vs_stationary_24light | 0.000581 | -1.12 |
| Title | Cluster Plot | Dendrogram | e-value | e-value | e-value | Condition | Condition FDR | Condition Difference |
|---|---|---|---|---|---|---|---|---|
| Thaps_hclust_0071 |
 |
 |
0.0000019 |
0.0000028 |
0.00008 |
exponential_vs_stationary_24highlight | 0.000526 | 0.319 |
| Thaps_hclust_0071 |
|
|
0.0000019 |
0.0000028 |
0.00008 |
exponential_vs_stationary_24light | 0.000581 | 1.88 |
| Title | Cluster Plot | Dendrogram | e-value | e-value | e-value | Condition | Condition FDR | Condition Difference |
|---|---|---|---|---|---|---|---|---|
| Thaps_hclust_0300 |
 |
 |
0.05 |
11 |
3.8 |
exponential_vs_stationary_24highlight | 0.000526 | -0.713 |
| Thaps_hclust_0300 |
|
|
0.05 |
11 |
3.8 |
exponential_vs_stationary_24light | 0.000581 | -1.26 |
| Title | Cluster Plot | Dendrogram | e-value | e-value | e-value | Condition | Condition FDR | Condition Difference |
|---|---|---|---|---|---|---|---|---|
| Thaps_hclust_0318 |
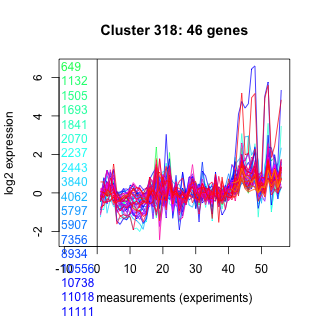 |
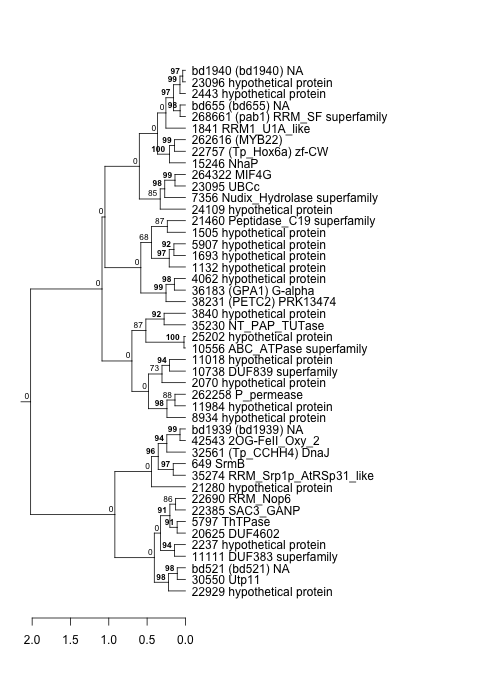 |
1.1e-17 |
0.000000015 |
0.0000081 |
exponential_vs_stationary_24highlight | 0.000526 | -0.339 |
| Thaps_hclust_0318 |
|
|
1.1e-17 |
0.000000015 |
0.0000081 |
exponential_vs_stationary_24light | 0.000581 | -0.668 |
| Title | Cluster Plot | Dendrogram | e-value | e-value | e-value | Condition | Condition FDR | Condition Difference |
|---|---|---|---|---|---|---|---|---|
| Thaps_hclust_0335 |
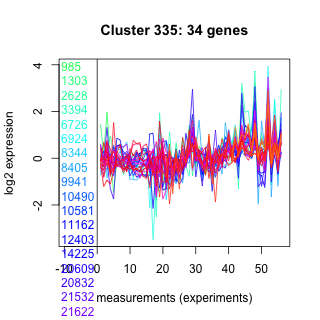 |
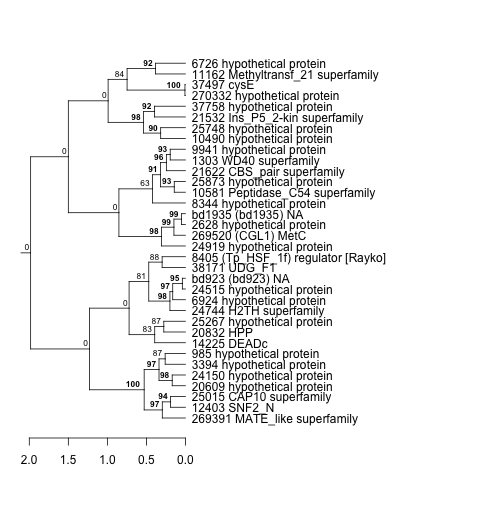 |
0.0000000032 |
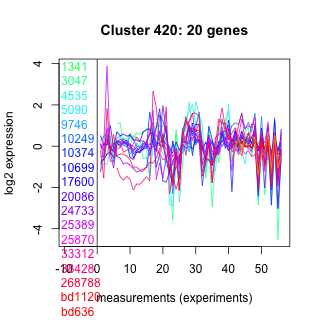
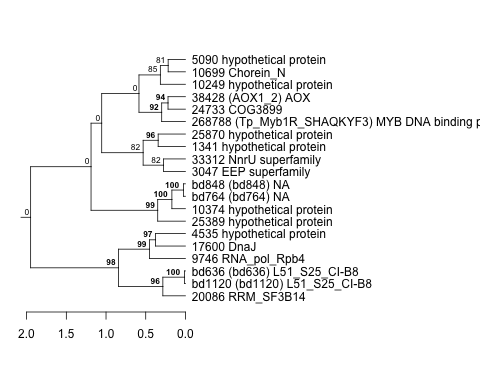
0.000001 |
0.019 |
exponential_vs_stationary_24highlight | 0.000526 | -0.599 |
| Thaps_hclust_0335 |
|
|
0.0000000032 |
0.000001 |
0.019 |
exponential_vs_stationary_24light | 0.000581 | -1.03 |
| Title | Cluster Plot | Dendrogram | e-value | e-value | e-value | Condition | Condition FDR | Condition Difference |
|---|---|---|---|---|---|---|---|---|
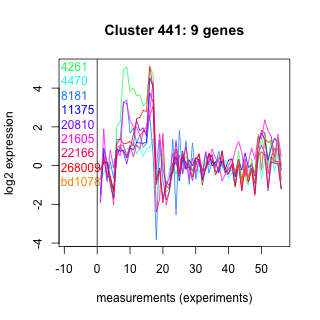
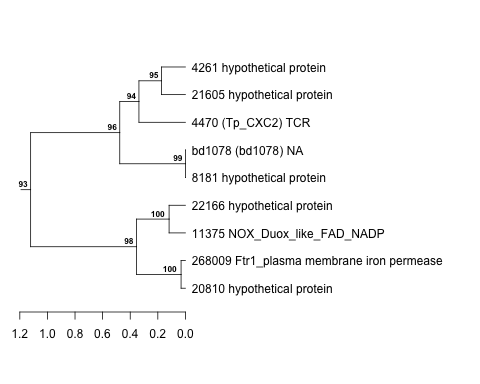
| Thaps_hclust_0441 |
 |
 |
0.00081 |
0.001 |
0.0015 |
exponential_vs_stationary_24highlight | 0.000526 | 0.741 |
| Title | Cluster Plot | Dendrogram | e-value | e-value | e-value | Condition | Condition FDR | Condition Difference |
|---|---|---|---|---|---|---|---|---|
| Thaps_hclust_0230 |
 |
|
|
1.1e-30 |
0.0000000000029 |
exponential_vs_stationary_24highlight | 0.000526 | -0.223 |
| Thaps_hclust_0230 |
|
|
|
1.1e-30 |
0.0000000000029 |
exponential_vs_stationary_24light | 0.000581 | -0.701 |
| Title | Cluster Plot | Dendrogram | e-value | e-value | e-value | Condition | Condition FDR | Condition Difference |
|---|---|---|---|---|---|---|---|---|
| Thaps_hclust_0070 |
 |
 |
0.00015 |
0.0025 |
0.041 |
exponential_vs_stationary_24highlight | 0.000526 | 0.547 |
| Thaps_hclust_0070 |
|
|
0.00015 |
0.0025 |
0.041 |
exponential_vs_stationary_24light | 0.000581 | 1.75 |
| Title | Cluster Plot | Dendrogram | e-value | e-value | e-value | Condition | Condition FDR | Condition Difference |
|---|---|---|---|---|---|---|---|---|
| Thaps_hclust_0423 |
 |
 |
0.00046 |
0.13 |
9.2 |
exponential_vs_stationary_24highlight | 0.000526 | -0.419 |
| Title | Cluster Plot | Dendrogram | e-value | e-value | e-value | Condition | Condition FDR | Condition Difference |
|---|---|---|---|---|---|---|---|---|
| Thaps_hclust_0334 |
 |
 |
0.51 |
0.00047 |
0.25 |
exponential_vs_stationary_24highlight | 0.000526 | -0.446 |
| Title | Cluster Plot | Dendrogram | e-value | e-value | e-value | Condition | Condition FDR | Condition Difference |
|---|---|---|---|---|---|---|---|---|
| Thaps_hclust_0017 |
 |
 |
4.6e-24 |
0.00000000000046 |
0.000000000000098 |
exponential_vs_stationary_24highlight | 0.000526 | 0.31 |
| Thaps_hclust_0017 |
|
|
4.6e-24 |
0.00000000000046 |
0.000000000000098 |
exponential_vs_stationary_24light | 0.000581 | 1.74 |
| Title | Cluster Plot | Dendrogram | e-value | e-value | e-value | Condition | Condition FDR | Condition Difference |
|---|---|---|---|---|---|---|---|---|
| Thaps_hclust_0052 |
 |
 |
1.4e-22 |
3.3e-19 |
0.0000000000037 |
exponential_vs_stationary_24highlight | 0.000526 | 0.247 |
| Title | Cluster Plot | Dendrogram | e-value | e-value | e-value | Condition | Condition FDR | Condition Difference |
|---|---|---|---|---|---|---|---|---|
| Thaps_hclust_0411 |
 |
 |
0.00079 |
0.0092 |
0.029 |
exponential_vs_stationary_24light | 0.000581 | -0.757 |
| Title | Cluster Plot | Dendrogram | e-value | e-value | e-value | Condition | Condition FDR | Condition Difference |
|---|---|---|---|---|---|---|---|---|
| Thaps_hclust_0216 |
 |
 |
0.0000076 |
0.019 |
0.0036 |
exponential_vs_stationary_24light | 0.000581 | 0.705 |
| Title | Cluster Plot | Dendrogram | e-value | e-value | e-value | Condition | Condition FDR | Condition Difference |
|---|---|---|---|---|---|---|---|---|
| Thaps_hclust_0092 |
 |
|
1.3e-37 |
4.2e-20 |
0.0000000000000013 |
exponential_vs_stationary_24light | 0.000581 | 1.99 |
| Title | Cluster Plot | Dendrogram | e-value | e-value | e-value | Condition | Condition FDR | Condition Difference |
|---|---|---|---|---|---|---|---|---|
| Thaps_hclust_0073 |
 |
 |
0.013 |
0.043 |
210 |
exponential_vs_stationary_24light | 0.000581 | 1.35 |
| Title | Cluster Plot | Dendrogram | e-value | e-value | e-value | Condition | Condition FDR | Condition Difference |
|---|---|---|---|---|---|---|---|---|
| Thaps_hclust_0090 |
 |
 |
0.23 |
2.7 |
11 |
exponential_vs_stationary_24light | 0.000581 | 1.5 |
| Title | Cluster Plot | Dendrogram | e-value | e-value | e-value | Condition | Condition FDR | Condition Difference |
|---|---|---|---|---|---|---|---|---|
| Thaps_hclust_0424 |
 |
 |
0.012 |
0.74 |
0.26 |
exponential_vs_stationary_24light | 0.000581 | -1.59 |
| Title | Cluster Plot | Dendrogram | e-value | e-value | e-value | Condition | Condition FDR | Condition Difference |
|---|---|---|---|---|---|---|---|---|
| Thaps_hclust_0211 |
 |
 |
0.000000055 |
0.00014 |
0.026 |
exponential_vs_stationary_24light | 0.000581 | 0.755 |
| Title | Cluster Plot | Dendrogram | e-value | e-value | e-value | Condition | Condition FDR | Condition Difference |
|---|---|---|---|---|---|---|---|---|
| Thaps_hclust_0069 |
 |
 |
1.2e-26 |
2.6e-24 |
2.4e-20 |
exponential_vs_stationary_24light | 0.000581 | 2.1 |
| Title | Cluster Plot | Dendrogram | e-value | e-value | e-value | Condition | Condition FDR | Condition Difference |
|---|---|---|---|---|---|---|---|---|
| Thaps_hclust_0175 |
 |
 |
0.00000000000027 |
0.0000042 |
0.58 |
exponential_vs_stationary_24light | 0.000581 | 1.18 |
| Title | Cluster Plot | Dendrogram | e-value | e-value | e-value | Condition | Condition FDR | Condition Difference |
|---|---|---|---|---|---|---|---|---|
| Thaps_hclust_0086 |
 |
 |
0.0000000068 |
0.01 |
0.0037 |
exponential_vs_stationary_24light | 0.000581 | 1.24 |
| Title | Cluster Plot | Dendrogram | e-value | e-value | e-value | Condition | Condition FDR | Condition Difference |
|---|---|---|---|---|---|---|---|---|
| Thaps_hclust_0421 |
 |
 |
0.0000074 |
0.00013 |
0.34 |
exponential_vs_stationary_24light | 0.000581 | -1.77 |
| Title | Cluster Plot | Dendrogram | e-value | e-value | e-value | Condition | Condition FDR | Condition Difference |
|---|---|---|---|---|---|---|---|---|
| Thaps_hclust_0087 |
 |
 |
0.00000000000011 |
0.000026 |
0.028 |
exponential_vs_stationary_24light | 0.000581 | 1.03 |
| Title | Cluster Plot | Dendrogram | e-value | e-value | e-value | Condition | Condition FDR | Condition Difference |
|---|---|---|---|---|---|---|---|---|
| Thaps_hclust_0210 |
 |
 |
0.0000000000046 |
0.0000033 |
0.086 |
exponential_vs_stationary_24light | 0.000581 | 2.07 |
| Title | Cluster Plot | Dendrogram | e-value | e-value | e-value | Condition | Condition FDR | Condition Difference |
|---|---|---|---|---|---|---|---|---|
| Thaps_hclust_0422 |
 |
 |
1.9 |
15 |
0.0027 |
exponential_vs_stationary_24light | 0.000581 | -1.75 |
| Title | Cluster Plot | Dendrogram | e-value | e-value | e-value | Condition | Condition FDR | Condition Difference |
|---|---|---|---|---|---|---|---|---|
| Thaps_hclust_0016 |
 |
 |
0.000000000083 |
0.00000025 |
0.00000028 |
exponential_vs_stationary_24light | 0.000581 | 1.18 |
| Title | Cluster Plot | Dendrogram | e-value | e-value | e-value | Condition | Condition FDR | Condition Difference |
|---|---|---|---|---|---|---|---|---|
| Thaps_hclust_0122 |
 |
 |
0.0000037 |
0.061 |
0.0018 |
exponential_vs_stationary_24light | 0.000581 | -1.09 |
| Title | Cluster Plot | Dendrogram | e-value | e-value | e-value | Condition | Condition FDR | Condition Difference |
|---|---|---|---|---|---|---|---|---|
| Thaps_hclust_0420 |
 |
 |
0.000009 |
0.00077 |
0.53 |
exponential_vs_stationary_24light | 0.000581 | -1.34 |
| Title | Cluster Plot | Dendrogram | e-value | e-value | e-value | Condition | Condition FDR | Condition Difference |
|---|---|---|---|---|---|---|---|---|
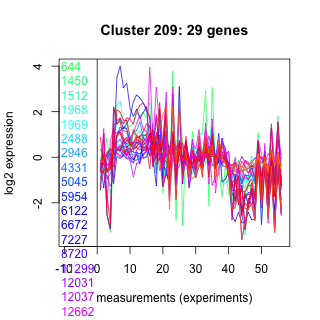
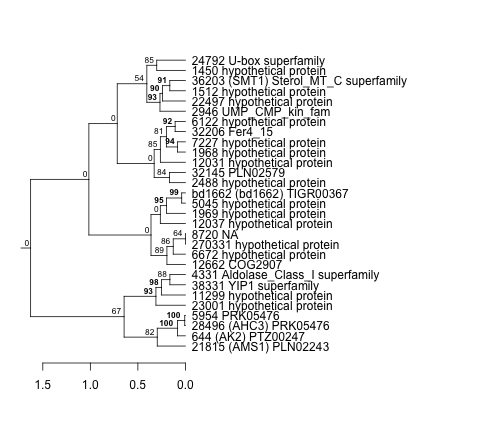
| Thaps_hclust_0209 |
 |
 |
1.2e-16 |
0.00011 |
0.000027 |
exponential_vs_stationary_24light | 0.000581 | 1.36 |
| Title | Cluster Plot | Dendrogram | e-value | e-value | e-value | Condition | Condition FDR | Condition Difference |
|---|---|---|---|---|---|---|---|---|
| Thaps_hclust_0332 |
 |
 |
0.000000055 |
0.0000013 |
0.0037 |
exponential_vs_stationary_24light | 0.000581 | -1.04 |
| Title | Cluster Plot | Dendrogram | e-value | e-value | e-value | Condition | Condition FDR | Condition Difference |
|---|---|---|---|---|---|---|---|---|
| Thaps_hclust_0015 |
 |
|
2.5e-25 |
7.4e-21 |
0.0000000011 |
exponential_vs_stationary_24light | 0.000581 | 2.9 |
| Title | Cluster Plot | Dendrogram | e-value | e-value | e-value | Condition | Condition FDR | Condition Difference |
|---|---|---|---|---|---|---|---|---|
| Thaps_hclust_0032 |
 |
 |
1.3e-16 |
0.00000035 |
0.00012 |
exponential_vs_stationary_24light | 0.000581 | 0.831 |
| Title | Cluster Plot | Dendrogram | e-value | e-value | e-value | Condition | Condition FDR | Condition Difference |
|---|---|---|---|---|---|---|---|---|
| Thaps_hclust_0033 |
 |
 |
0.000000000000011 |
0.0012 |
0.0073 |
exponential_vs_stationary_24light | 0.000581 | 0.722 |
| Title | Cluster Plot | Dendrogram | e-value | e-value | e-value | Condition | Condition FDR | Condition Difference |
|---|---|---|---|---|---|---|---|---|
| Thaps_hclust_0085 |
 |
 |
0.000012 |
0.0024 |
0.37 |
exponential_vs_stationary_24light | 0.000581 | 1.46 |
| Title | Cluster Plot | Dendrogram | e-value | e-value | e-value | Condition | Condition FDR | Condition Difference |
|---|---|---|---|---|---|---|---|---|
| Thaps_hclust_0208 |
 |
|
1.2e-20 |
0.0000000000000057 |
0.0000000099 |
exponential_vs_stationary_24light | 0.000581 | 0.911 |
| Title | Cluster Plot | Dendrogram | e-value | e-value | e-value | Condition | Condition FDR | Condition Difference |
|---|---|---|---|---|---|---|---|---|
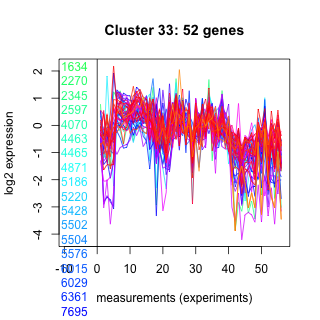
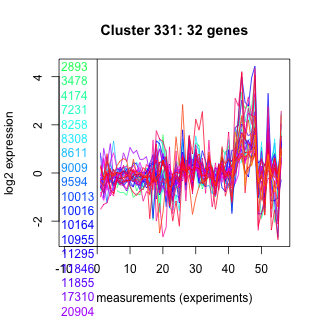
| Thaps_hclust_0331 |
 |
 |
0.000000000011 |
20 |
1600 |
exponential_vs_stationary_24light | 0.000581 | -1.09 |
| Title | Cluster Plot | Dendrogram | e-value | e-value | e-value | Condition | Condition FDR | Condition Difference |
|---|---|---|---|---|---|---|---|---|
| Thaps_hclust_0014 |
 |
 |
Not available | Not available | Not available | exponential_vs_stationary_24light | 0.000581 | 1.39 |
| Title | Cluster Plot | Dendrogram | e-value | e-value | e-value | Condition | Condition FDR | Condition Difference |
|---|---|---|---|---|---|---|---|---|
| Thaps_hclust_0366 |
 |
 |
0.000011 |
0.054 |
0.47 |
exponential_vs_stationary_24light | 0.000581 | -0.749 |
| Title | Cluster Plot | Dendrogram | e-value | e-value | e-value | Condition | Condition FDR | Condition Difference |
|---|---|---|---|---|---|---|---|---|
| Thaps_hclust_0049 |
 |
 |
0.00054 |
0.0063 |
0.03 |
exponential_vs_stationary_24light | 0.000581 | 0.86 |
| Title | Cluster Plot | Dendrogram | e-value | e-value | e-value | Condition | Condition FDR | Condition Difference |
|---|---|---|---|---|---|---|---|---|
| Thaps_hclust_0384 |
 |
 |
0.0000000074 |
0.000000031 |
0.12 |
exponential_vs_stationary_24light | 0.000581 | 1.15 |
| Title | Cluster Plot | Dendrogram | e-value | e-value | e-value | Condition | Condition FDR | Condition Difference |
|---|---|---|---|---|---|---|---|---|
| Thaps_hclust_0030 |
 |
 |
0.000056 |
0.048 |
0.088 |
exponential_vs_stationary_24light | 0.000581 | 0.974 |
| Title | Cluster Plot | Dendrogram | e-value | e-value | e-value | Condition | Condition FDR | Condition Difference |
|---|---|---|---|---|---|---|---|---|
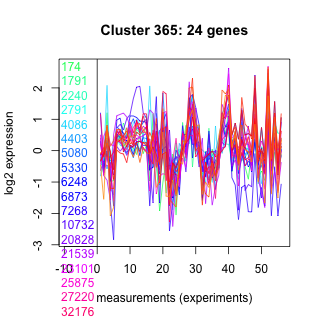
| Thaps_hclust_0365 |
 |
 |
0.00082 |
0.0000019 |
2 |
exponential_vs_stationary_24light | 0.000581 | -1.1 |
| Title | Cluster Plot | Dendrogram | e-value | e-value | e-value | Condition | Condition FDR | Condition Difference |
|---|---|---|---|---|---|---|---|---|
| Thaps_hclust_0048 |
 |
 |
4.8e-17 |
0.000000018 |
0.0000097 |
exponential_vs_stationary_24light | 0.000581 | 1.15 |
| Title | Cluster Plot | Dendrogram | e-value | e-value | e-value | Condition | Condition FDR | Condition Difference |
|---|---|---|---|---|---|---|---|---|
| Thaps_hclust_0065 |
 |
 |
1.5e-32 |
2.5e-32 |
9.9e-33 |
exponential_vs_stationary_24light | 0.000581 | 1.26 |
| Title | Cluster Plot | Dendrogram | e-value | e-value | e-value | Condition | Condition FDR | Condition Difference |
|---|---|---|---|---|---|---|---|---|
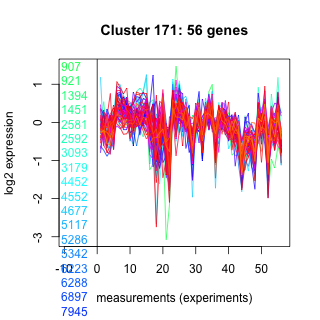
| Thaps_hclust_0171 |
 |
 |
0.0000000000052 |
0.000000000056 |
0.000000000083 |
exponential_vs_stationary_24light | 0.000581 | 0.587 |
| Title | Cluster Plot | Dendrogram | e-value | e-value | e-value | Condition | Condition FDR | Condition Difference |
|---|---|---|---|---|---|---|---|---|
| Thaps_hclust_0066 |
 |
 |
0.0000000000000019 |
0.00000025 |
0.00000047 |
exponential_vs_stationary_24light | 0.000581 | 1.04 |
| Title | Cluster Plot | Dendrogram | e-value | e-value | e-value | Condition | Condition FDR | Condition Difference |
|---|---|---|---|---|---|---|---|---|
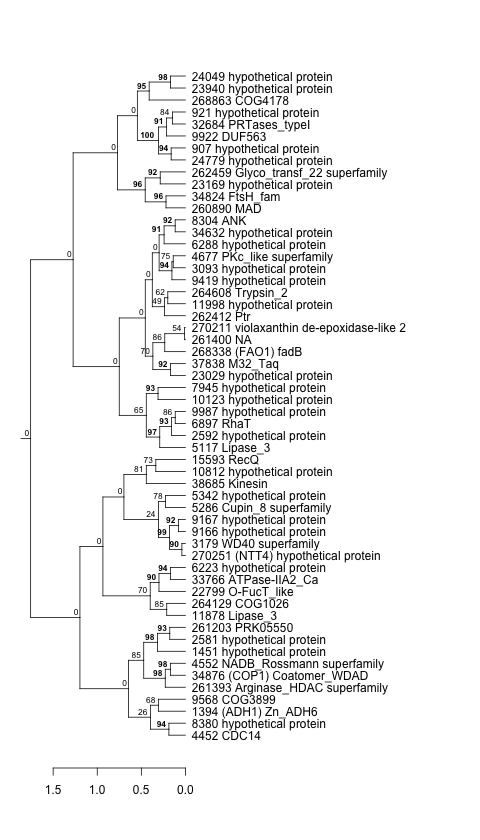
| Thaps_hclust_0418 |
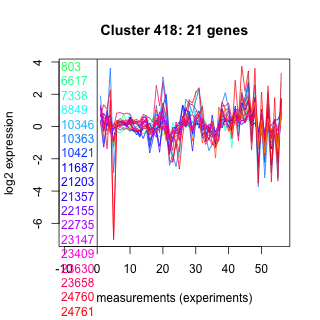 |
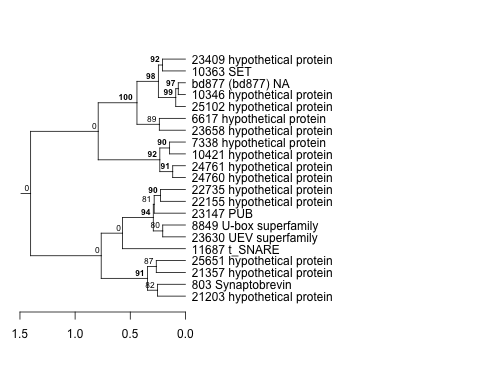 |
0.00074 |
0.0098 |
0.29 |
exponential_vs_stationary_24light | 0.000581 | -1.81 |
| Title | Cluster Plot | Dendrogram | e-value | e-value | e-value | Condition | Condition FDR | Condition Difference |
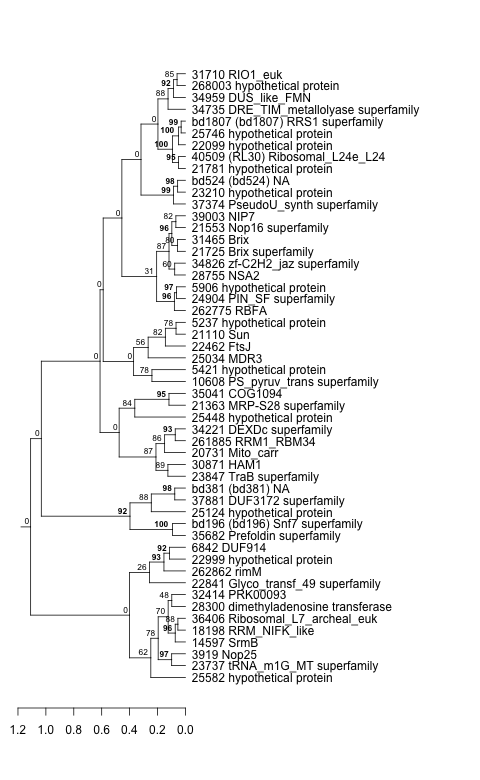
|---|---|---|---|---|---|---|---|---|
| Thaps_hclust_0101 |
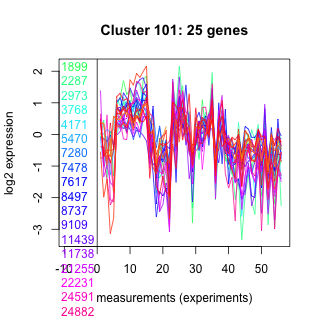 |
 |
0.000000016 |
0.0000038 |
0.014 |
exponential_vs_stationary_24light | 0.000581 | 0.819 |
| Title | Cluster Plot | Dendrogram | e-value | e-value | e-value | Condition | Condition FDR | Condition Difference |
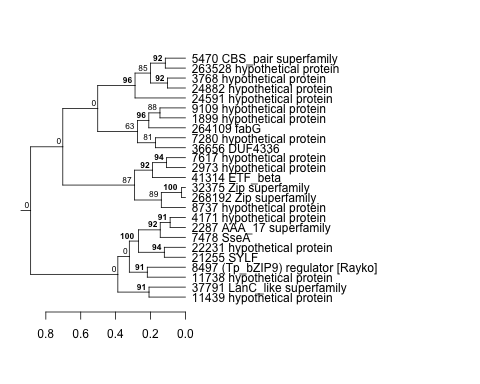
|---|---|---|---|---|---|---|---|---|
| Thaps_hclust_0224 |
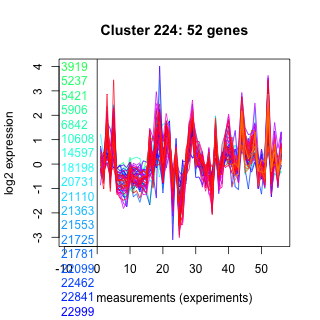 |
 |
9.3e-28 |
1.9e-21 |
0.046 |
exponential_vs_stationary_24light | 0.000581 | -1.22 |
| Title | Cluster Plot | Dendrogram | e-value | e-value | e-value | Condition | Condition FDR | Condition Difference |
|---|---|---|---|---|---|---|---|---|
| Thaps_hclust_0330 |
 |
 |
0.0000058 |
0.00000085 |
0.000041 |
exponential_vs_stationary_24light | 0.000581 | -1.85 |
| Title | Cluster Plot | Dendrogram | e-value | e-value | e-value | Condition | Condition FDR | Condition Difference |
|---|---|---|---|---|---|---|---|---|
| Thaps_hclust_0064 |
 |
 |
0.000000012 |
0.00000073 |
0.0000002 |
exponential_vs_stationary_24light | 0.000581 | 1.3 |