Hierarchical Clusters
Displaying 1001 - 1100 of 28001
| Title | Cluster Plot | Dendrogram | e-value | e-value | e-value | Condition | Condition FDR | Condition Difference |
|---|---|---|---|---|---|---|---|---|
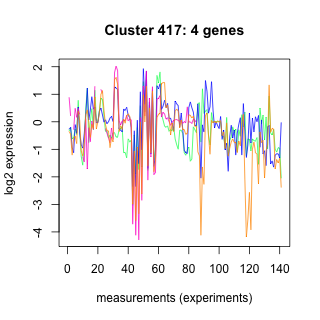
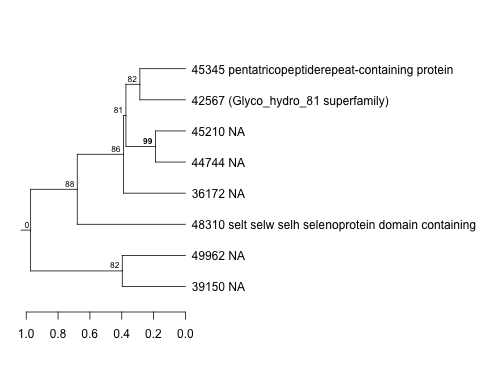
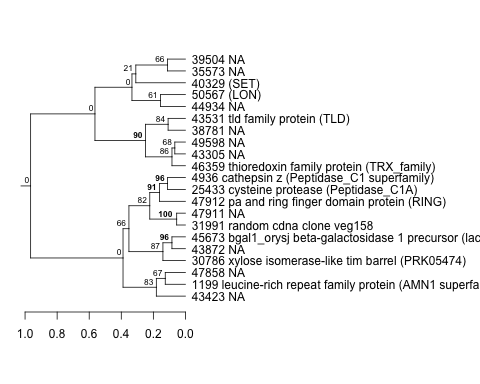
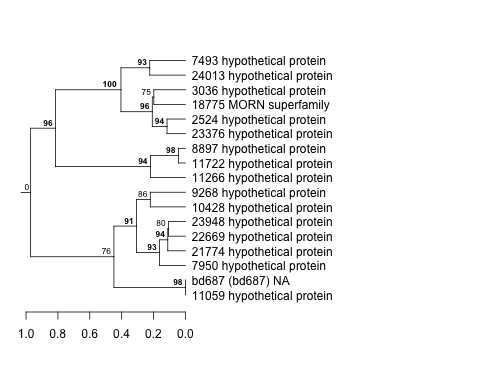
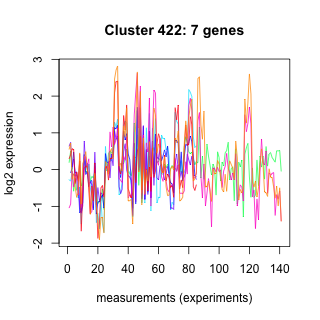
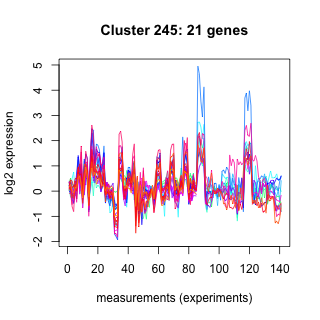
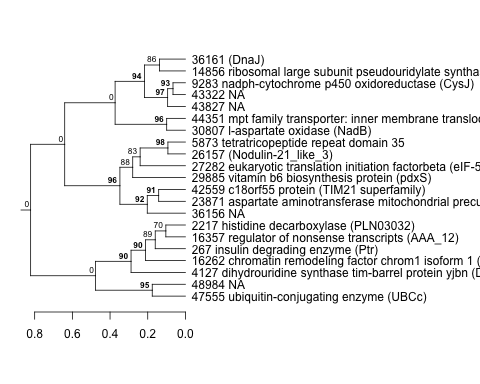
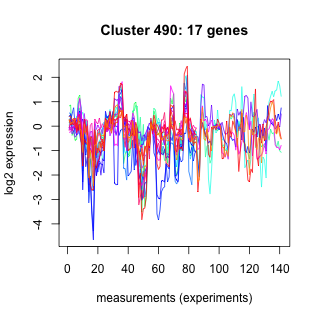
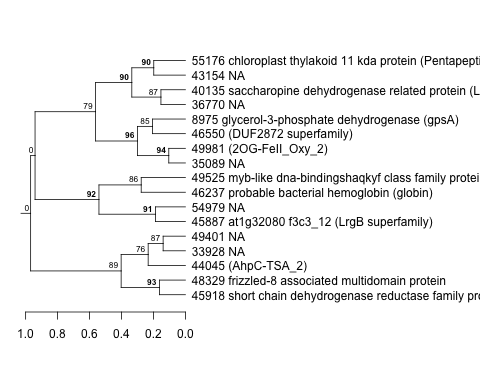
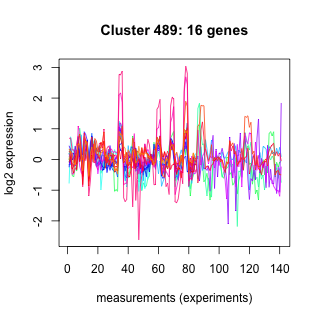
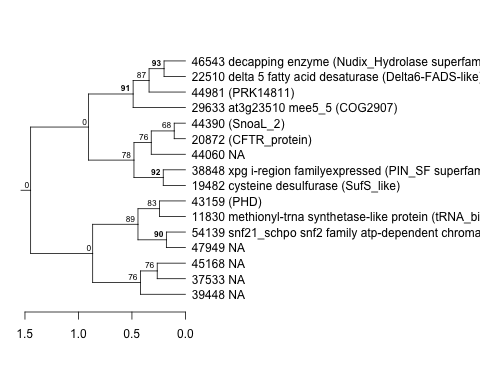
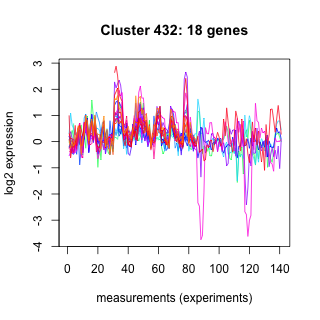
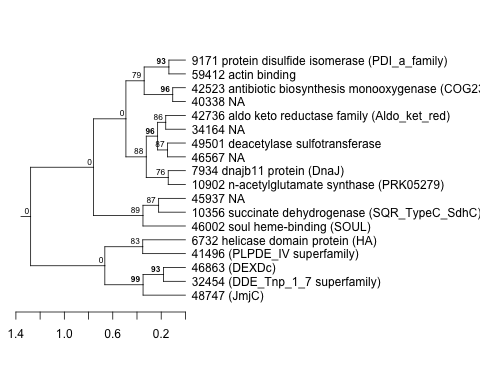
| Phatr_hclust_0417 |
 |
 |
56 |
500 |
560 |
Dark_treated | 0.458896 | 1.0292 |
| Phatr_hclust_0417 |
|
|
56 |
500 |
560 |
RedLight_0.5h | 0.255578 | 1.01173 |
| Title | Cluster Plot | Dendrogram | e-value | e-value | e-value | Condition | Condition FDR | Condition Difference |
|---|---|---|---|---|---|---|---|---|
| Phatr_hclust_0001 |
 |
 |
52 |
180 |
370 |
Dispersed_oil_SH | 0.000676 | 1.02717 |
| Title | Cluster Plot | Dendrogram | e-value | e-value | e-value | Condition | Condition FDR | Condition Difference |
|---|---|---|---|---|---|---|---|---|
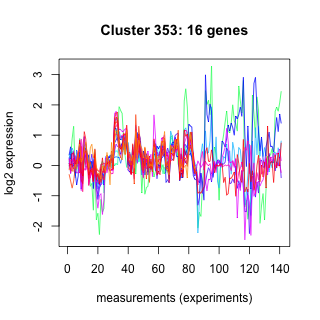
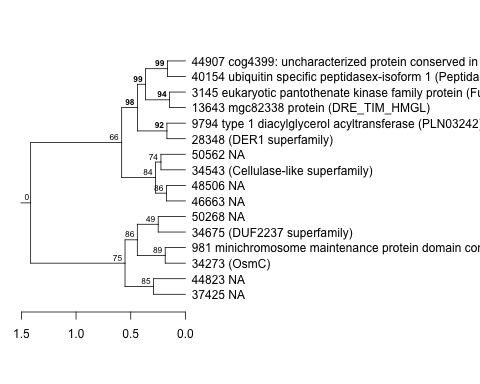
| Phatr_hclust_0353 |
 |
 |
800 |
3600 |
9100 |
Dark_treated | 0.114831 | 1.02691 |
| Title | Cluster Plot | Dendrogram | e-value | e-value | e-value | Condition | Condition FDR | Condition Difference |
|---|---|---|---|---|---|---|---|---|
| Phatr_hclust_0459 |
 |
 |
190 |
250 |
63 |
GreenLight_24h | 0.000962 | 1.02672 |
| Title | Cluster Plot | Dendrogram | e-value | e-value | e-value | Condition | Condition FDR | Condition Difference |
|---|---|---|---|---|---|---|---|---|
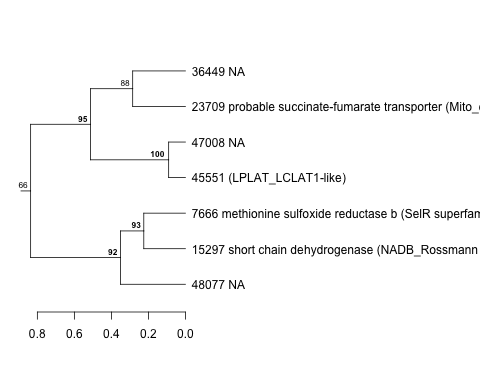
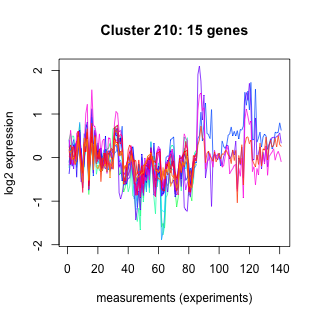
| Phatr_hclust_0210 |
 |
 |
470 |
470 |
310 |
Mixture_SH | 0.005128 | 1.02607 |
| Phatr_hclust_0210 |
|
|
470 |
470 |
310 |
Ammonia_SH | 0.006593 | 0.986286 |
| Title | Cluster Plot | Dendrogram | e-value | e-value | e-value | Condition | Condition FDR | Condition Difference |
|---|---|---|---|---|---|---|---|---|
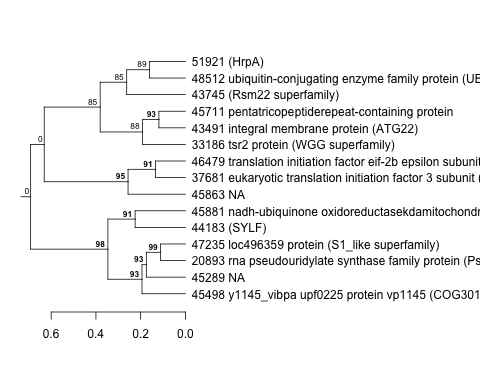
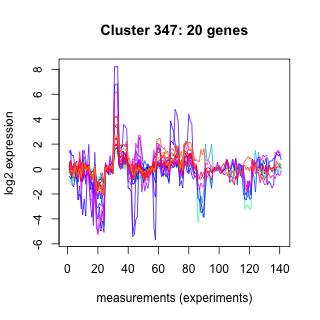
| Phatr_hclust_0347 |
 |
 |
220 |
290 |
2100 |
GreenLight_6h | 0.000610 | 1.02592 |
| Phatr_hclust_0347 |
|
|
220 |
290 |
2100 |
BlueLight_6h | 0.000581 | 1.02284 |
| Title | Cluster Plot | Dendrogram | e-value | e-value | e-value | Condition | Condition FDR | Condition Difference |
|---|---|---|---|---|---|---|---|---|
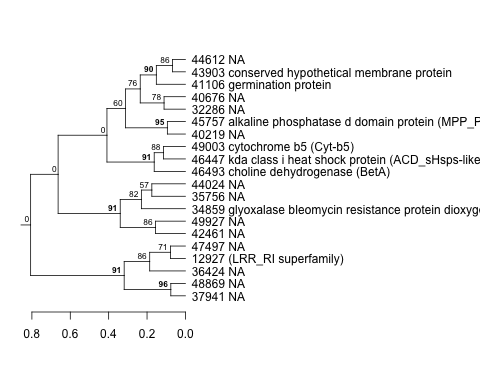
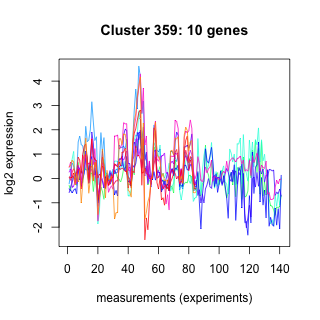
| Phatr_hclust_0359 |
 |
 |
9.7 |
150 |
650 |
BlueLight_0.5h | 0.122889 | 1.02354 |
| Phatr_hclust_0359 |
|
|
9.7 |
150 |
650 |
GreenLight_6h | 0.000610 | 0.99411 |
| Phatr_hclust_0359 |
|
|
9.7 |
150 |
650 |
Blue_vs_Red_6h | 0.003030 | 0.986086 |
| Title | Cluster Plot | Dendrogram | e-value | e-value | e-value | Condition | Condition FDR | Condition Difference |
|---|---|---|---|---|---|---|---|---|
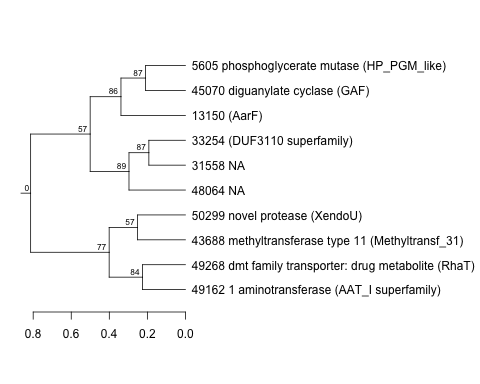
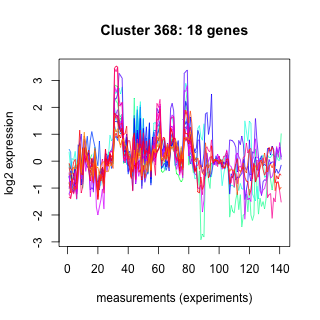
| Phatr_hclust_0368 |
 |
 |
23 |
73 |
480 |
GreenLight_0.5h | 0.007241 | 1.02303 |
| Title | Cluster Plot | Dendrogram | e-value | e-value | e-value | Condition | Condition FDR | Condition Difference |
|---|---|---|---|---|---|---|---|---|
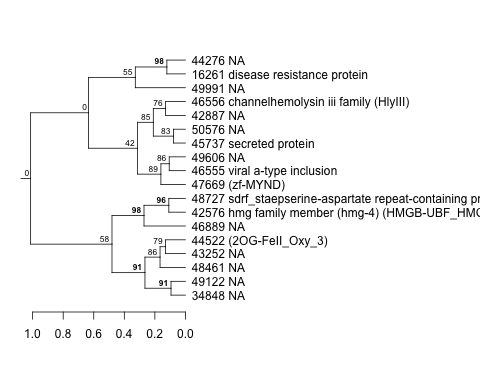
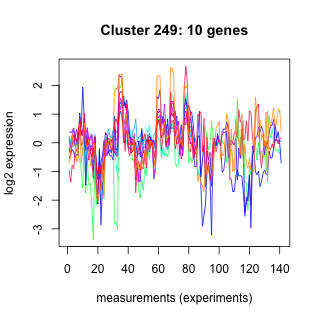
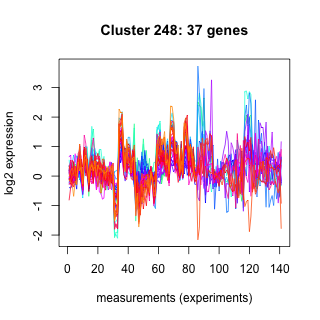
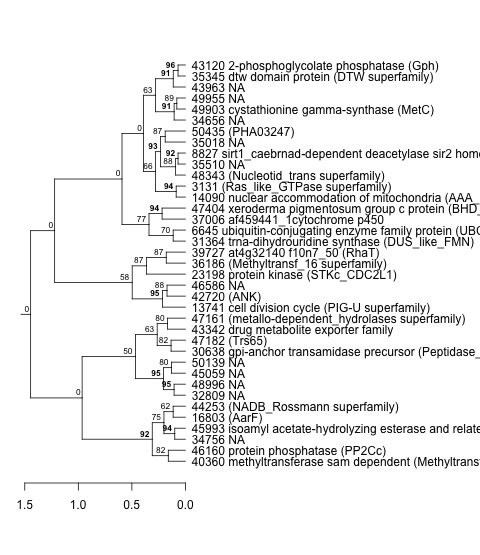
| Phatr_hclust_0249 |
 |
 |
6.1 |
0.36 |
390 |
RedLight_0.5h | 0.062088 | 1.02293 |
| Title | Cluster Plot | Dendrogram | e-value | e-value | e-value | Condition | Condition FDR | Condition Difference |
|---|---|---|---|---|---|---|---|---|
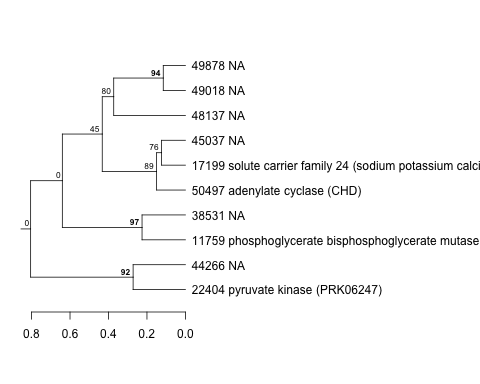
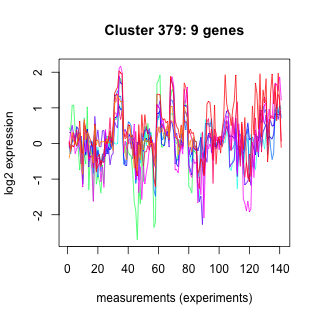
| Phatr_hclust_0379 |
 |
 |
13 |
380 |
1000 |
Simazine_SH | 0.000424 | 1.02174 |
| Title | Cluster Plot | Dendrogram | e-value | e-value | e-value | Condition | Condition FDR | Condition Difference |
|---|---|---|---|---|---|---|---|---|
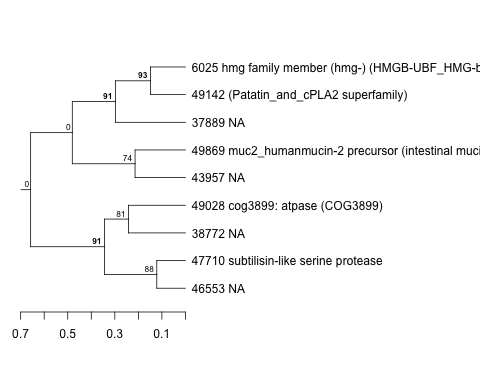
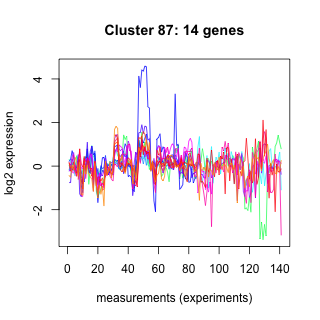
| Phatr_hclust_0087 |
 |
 |
76 |
110 |
110 |
light_10.5hr | 0.001485 | 1.02166 |
| Title | Cluster Plot | Dendrogram | e-value | e-value | e-value | Condition | Condition FDR | Condition Difference |
|---|---|---|---|---|---|---|---|---|
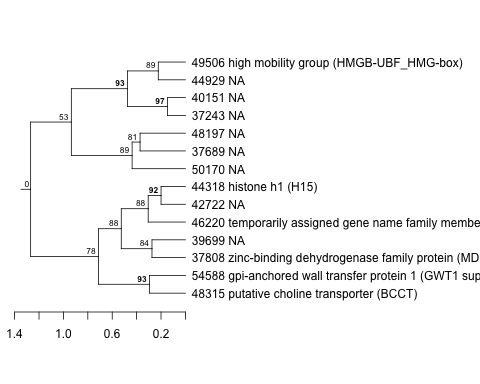
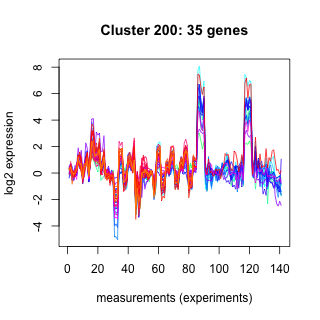
| Phatr_hclust_0200 |
 |
 |
0.0081 |
37 |
1400 |
Re-illuminated_0.5h | 0.000746 | 1.02148 |
| Phatr_hclust_0200 |
|
|
0.0081 |
37 |
1400 |
BlueLight_0.5h | 0.004828 | 1.00137 |
| Phatr_hclust_0200 |
|
|
0.0081 |
37 |
1400 |
GreenLight_0.5h | 0.000459 | 0.998517 |
| Title | Cluster Plot | Dendrogram | e-value | e-value | e-value | Condition | Condition FDR | Condition Difference |
|---|---|---|---|---|---|---|---|---|
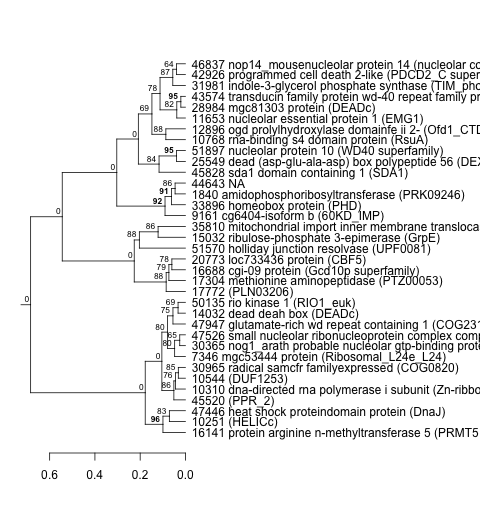
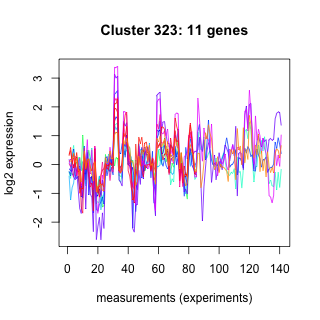
| Phatr_hclust_0323 |
 |
 |
48 |
240 |
260 |
RedLight_0.5h | 0.051117 | 1.02135 |
| Title | Cluster Plot | Dendrogram | e-value | e-value | e-value | Condition | Condition FDR | Condition Difference |
|---|---|---|---|---|---|---|---|---|
| Thaps_hclust_0014 |
 |
 |
Not available | Not available | Not available | lowtemp_TMEVA | 0.000735 | 1.02 |
| Title | Cluster Plot | Dendrogram | e-value | e-value | e-value | Condition | Condition FDR | Condition Difference |
|---|---|---|---|---|---|---|---|---|
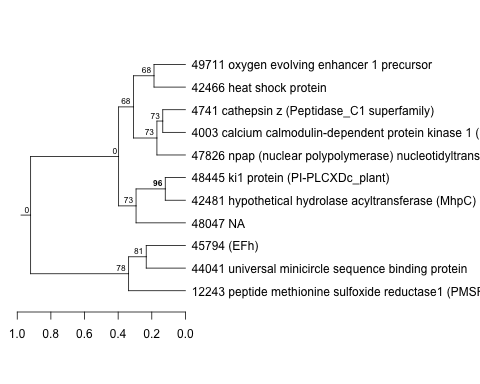
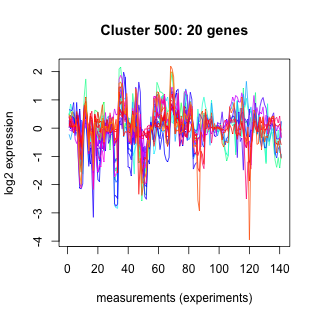
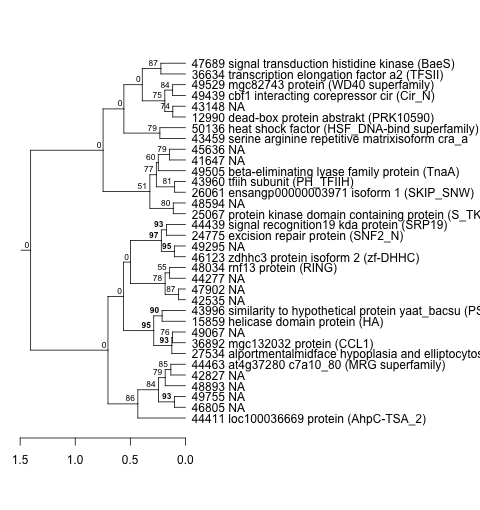
| Phatr_hclust_0500 |
 |
 |
7.1 |
14 |
120 |
GreenLight_0.5h | 0.006475 | 1.01818 |
| Phatr_hclust_0500 |
|
|
7.1 |
14 |
120 |
Re-illuminated_0.5h | 0.016763 | 0.992054 |
| Title | Cluster Plot | Dendrogram | e-value | e-value | e-value | Condition | Condition FDR | Condition Difference |
|---|---|---|---|---|---|---|---|---|
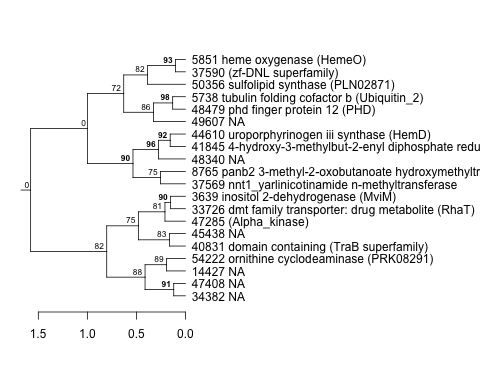
| Phatr_hclust_0326 |
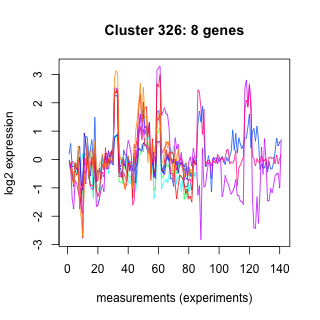 |
 |
420 |
700 |
550 |
light_16hr_dark_30min | 0.015417 | 1.01785 |
| Title | Cluster Plot | Dendrogram | e-value | e-value | e-value | Condition | Condition FDR | Condition Difference |
|---|---|---|---|---|---|---|---|---|
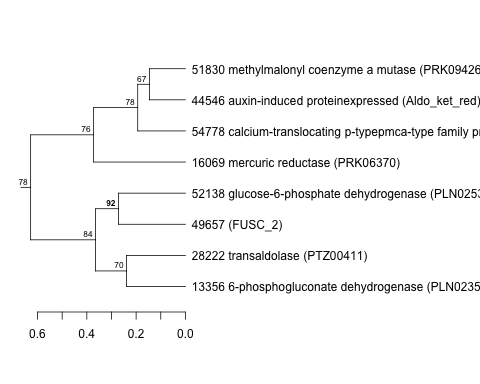
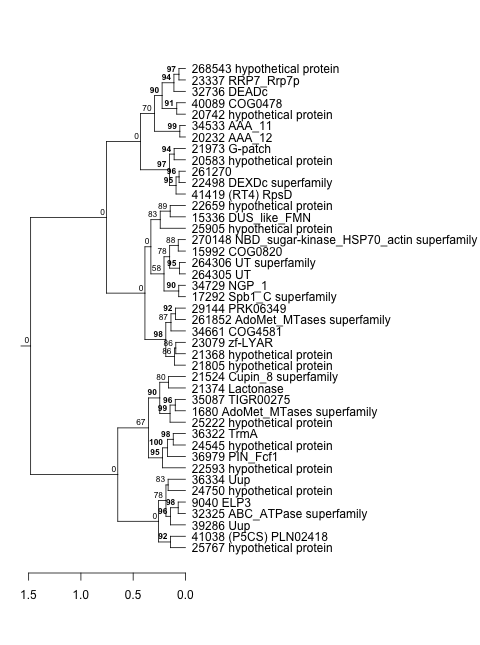
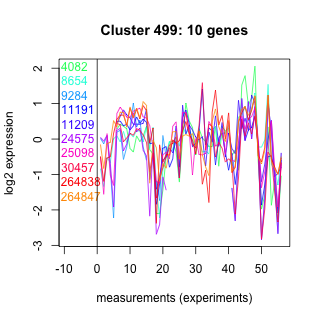
| Phatr_hclust_0499 |
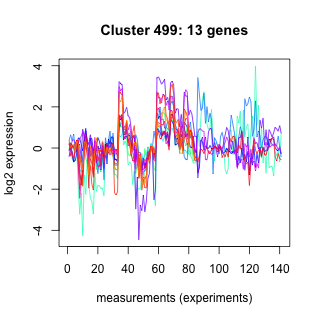 |
 |
1.7 |
150 |
1900 |
BlueLight_0.5h | 0.080476 | 1.01757 |
| Title | Cluster Plot | Dendrogram | e-value | e-value | e-value | Condition | Condition FDR | Condition Difference |
|---|---|---|---|---|---|---|---|---|
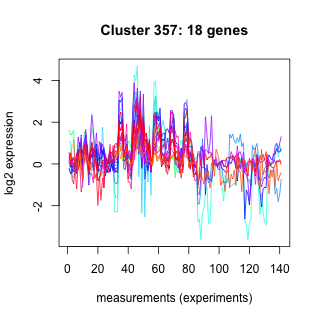
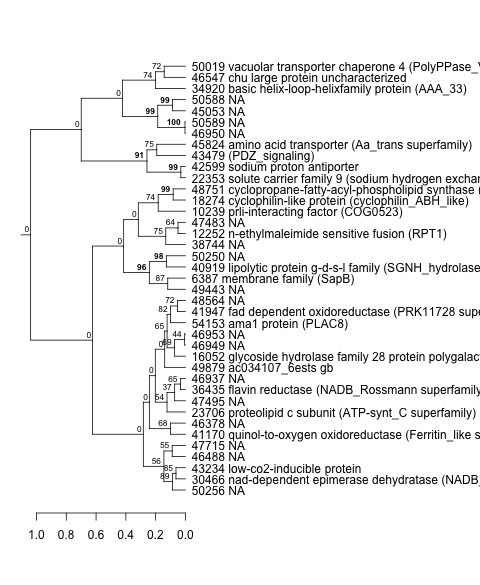
| Phatr_hclust_0357 |
 |
 |
0.86 |
7.5 |
180 |
light_15.5hr | 0.000625 | 1.01752 |
| Title | Cluster Plot | Dendrogram | e-value | e-value | e-value | Condition | Condition FDR | Condition Difference |
|---|---|---|---|---|---|---|---|---|
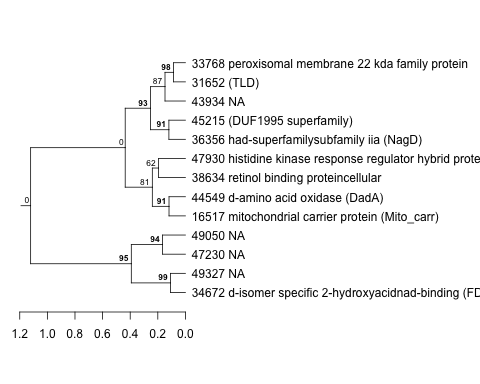
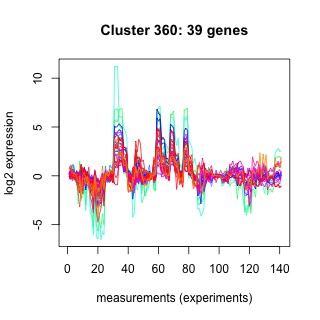
| Phatr_hclust_0360 |
 |
 |
1.6e-17 |
0.00000024 |
0.0000088 |
GreenLight_6h | 0.000610 | 1.01718 |
| Title | Cluster Plot | Dendrogram | e-value | e-value | e-value | Condition | Condition FDR | Condition Difference |
|---|---|---|---|---|---|---|---|---|
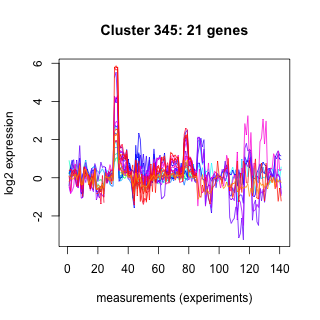
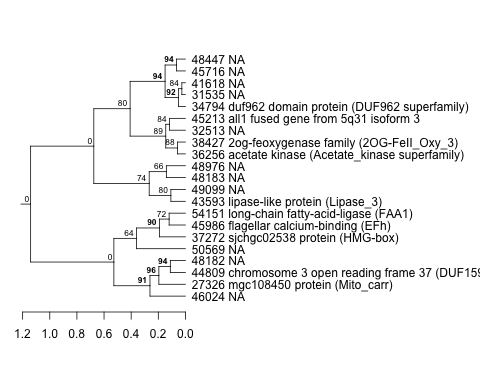
| Phatr_hclust_0345 |
 |
 |
0.68 |
20 |
86 |
BlueLight_0.5h | 0.022965 | 1.01664 |
| Title | Cluster Plot | Dendrogram | e-value | e-value | e-value | Condition | Condition FDR | Condition Difference |
|---|---|---|---|---|---|---|---|---|
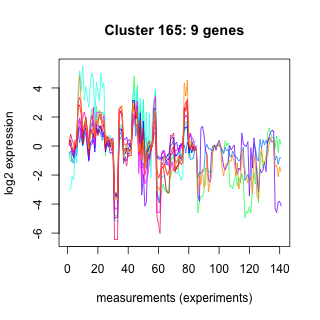
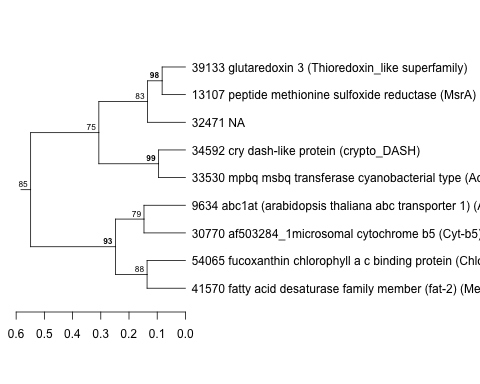
| Phatr_hclust_0165 |
 |
 |
80 |
130 |
460 |
Blue_vs_Green_6h | 0.001282 | 1.0165 |
| Title | Cluster Plot | Dendrogram | e-value | e-value | e-value | Condition | Condition FDR | Condition Difference |
|---|---|---|---|---|---|---|---|---|
| Phatr_hclust_0276 |
 |
 |
0.0001 |
0.00095 |
0.0055 |
Mixture_SH | 0.043898 | 1.01481 |
| Title | Cluster Plot | Dendrogram | e-value | e-value | e-value | Condition | Condition FDR | Condition Difference |
|---|---|---|---|---|---|---|---|---|
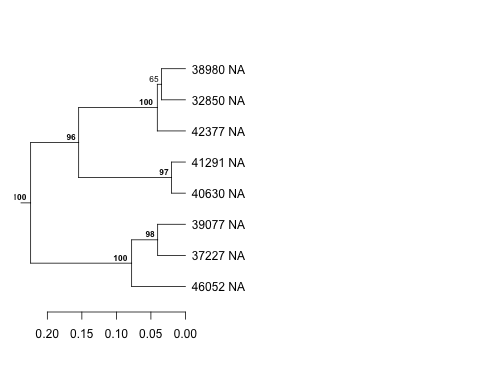
| Phatr_hclust_0336 |
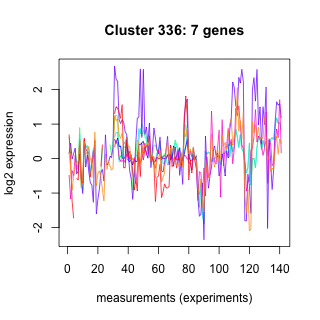 |
 |
0.0044 |
0.18 |
0.13 |
Dispersed_oil_SH | 0.000676 | 1.01312 |
| Title | Cluster Plot | Dendrogram | e-value | e-value | e-value | Condition | Condition FDR | Condition Difference |
|---|---|---|---|---|---|---|---|---|
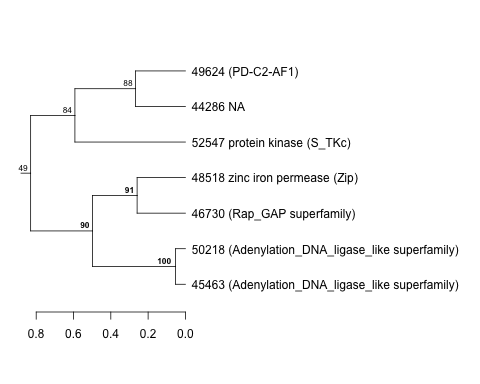
| Phatr_hclust_0325 |
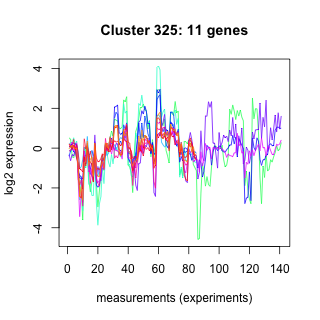 |
 |
0.086 |
53 |
150 |
Re-illuminated_6h | 0.000505 | 1.01164 |
| Title | Cluster Plot | Dendrogram | e-value | e-value | e-value | Condition | Condition FDR | Condition Difference |
|---|---|---|---|---|---|---|---|---|
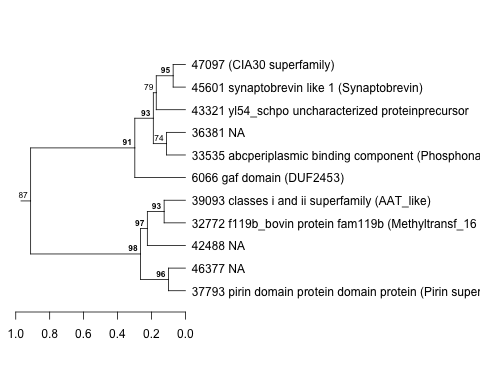
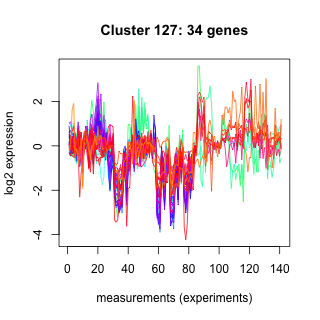
| Phatr_hclust_0127 |
 |
 |
1400 |
2000 |
5500 |
Mixture_SH | 0.000357 | 1.01141 |
| Title | Cluster Plot | Dendrogram | e-value | e-value | e-value | Condition | Condition FDR | Condition Difference |
|---|---|---|---|---|---|---|---|---|
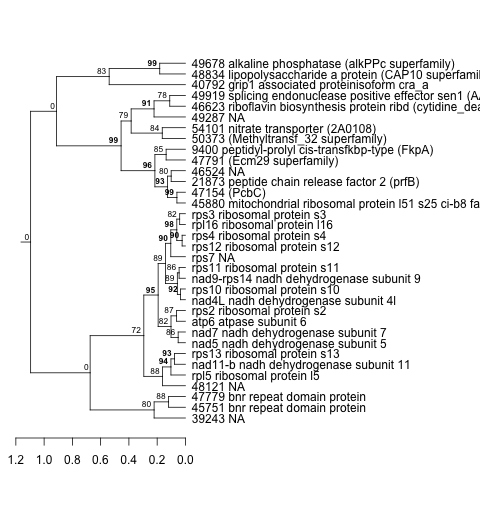
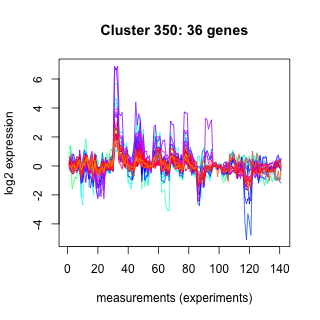
| Phatr_hclust_0350 |
 |
 |
0.0000019 |
4.5 |
2600 |
BlueLight_0.5h | 0.003676 | 1.0114 |
| Title | Cluster Plot | Dendrogram | e-value | e-value | e-value | Condition | Condition FDR | Condition Difference |
|---|---|---|---|---|---|---|---|---|
| Phatr_hclust_0455 |
 |
 |
67 |
430 |
710 |
Mixture_SH | 0.016300 | 1.01101 |
| Title | Cluster Plot | Dendrogram | e-value | e-value | e-value | Condition | Condition FDR | Condition Difference |
|---|---|---|---|---|---|---|---|---|
| Phatr_hclust_0082 |
 |
 |
2.4 |
13 |
42 |
light_15.5hr | 0.000625 | 1.01066 |
| Title | Cluster Plot | Dendrogram | e-value | e-value | e-value | Condition | Condition FDR | Condition Difference |
|---|---|---|---|---|---|---|---|---|
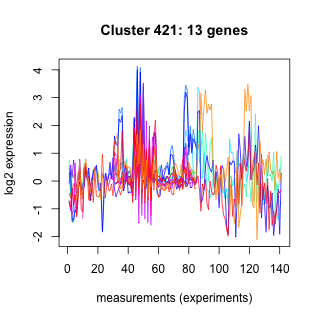
| Phatr_hclust_0421 |
 |
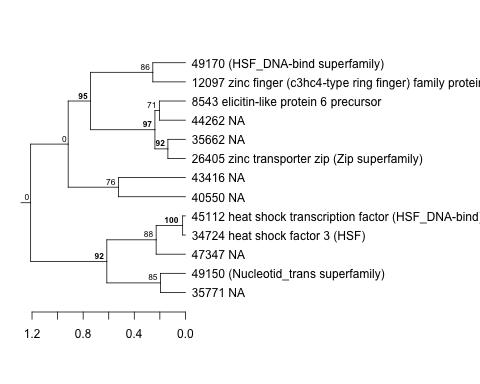 |
18 |
39 |
91 |
Ammonia_SH | 0.008205 | 1.01005 |
| Phatr_hclust_0421 |
|
|
18 |
39 |
91 |
BlueLight_0.5h | 0.091395 | 0.979203 |
| Title | Cluster Plot | Dendrogram | e-value | e-value | e-value | Condition | Condition FDR | Condition Difference |
|---|---|---|---|---|---|---|---|---|
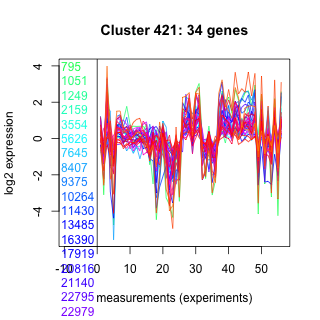
| Thaps_hclust_0421 |
 |
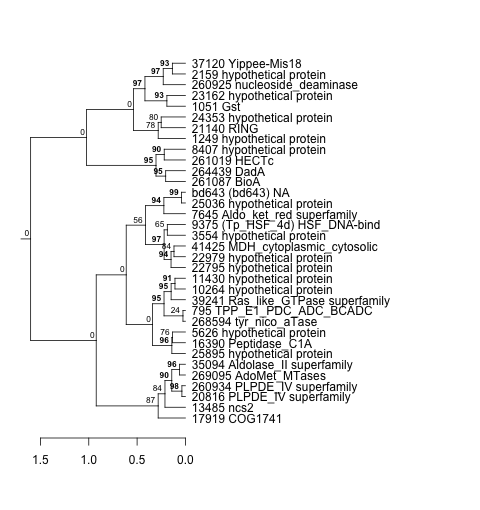 |
0.0000074 |
0.00013 |
0.34 |
highlight_arrays | 0.000442 | 1.01 |
| Title | Cluster Plot | Dendrogram | e-value | e-value | e-value | Condition | Condition FDR | Condition Difference |
|---|---|---|---|---|---|---|---|---|
| Thaps_hclust_0009 |
 |
 |
0.0000023 |
0.0000027 |
0.000035 |
exponential_vs_stationary_24light | 0.000581 | 1.01 |
| Title | Cluster Plot | Dendrogram | e-value | e-value | e-value | Condition | Condition FDR | Condition Difference |
|---|---|---|---|---|---|---|---|---|
| Thaps_hclust_0070 |
 |
 |
0.00015 |
0.0025 |
0.041 |
diel_exponential_vs_stationary | 0.000602 | 1.01 |
| Title | Cluster Plot | Dendrogram | e-value | e-value | e-value | Condition | Condition FDR | Condition Difference |
|---|---|---|---|---|---|---|---|---|
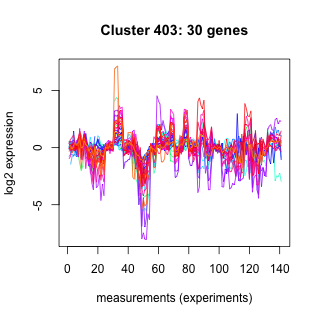
| Phatr_hclust_0403 |
 |
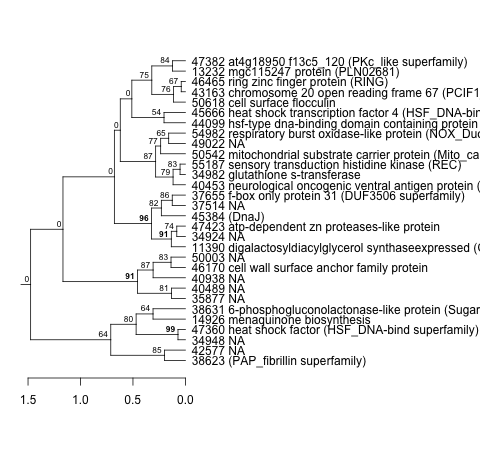 |
0.0000044 |
6.7 |
100 |
GreenLight_0.5h | 0.000885 | 1.00986 |
| Title | Cluster Plot | Dendrogram | e-value | e-value | e-value | Condition | Condition FDR | Condition Difference |
|---|---|---|---|---|---|---|---|---|
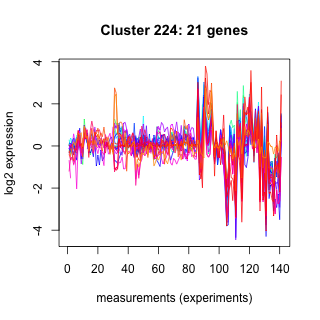
| Phatr_hclust_0224 |
 |
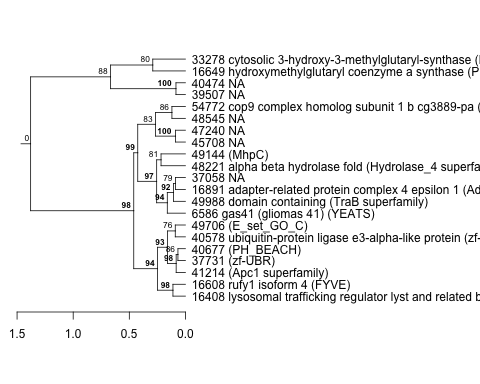 |
0.00033 |
1.2 |
2.8 |
Cadmium_SH | 0.000667 | 1.00933 |
| Title | Cluster Plot | Dendrogram | e-value | e-value | e-value | Condition | Condition FDR | Condition Difference |
|---|---|---|---|---|---|---|---|---|
| Phatr_hclust_0172 |
 |
 |
11 |
8.9 |
400 |
Mixture_SH | 0.023404 | 1.00823 |
| Title | Cluster Plot | Dendrogram | e-value | e-value | e-value | Condition | Condition FDR | Condition Difference |
|---|---|---|---|---|---|---|---|---|
| Phatr_hclust_0235 |
 |
 |
7.5 |
140 |
2000 |
Ammonia_SH | 0.015899 | 1.00749 |
| Title | Cluster Plot | Dendrogram | e-value | e-value | e-value | Condition | Condition FDR | Condition Difference |
|---|---|---|---|---|---|---|---|---|
| Phatr_hclust_0166 |
 |
 |
130 |
830 |
320 |
highlight_0to6h | 0.000806 | 1.0059 |
| Title | Cluster Plot | Dendrogram | e-value | e-value | e-value | Condition | Condition FDR | Condition Difference |
|---|---|---|---|---|---|---|---|---|
| Phatr_hclust_0119 |
 |
 |
0.0072 |
7.7 |
44 |
light_16hr_dark_30min | 0.000735 | 1.0058 |
| Phatr_hclust_0119 |
|
|
0.0072 |
7.7 |
44 |
light_10.5hr | 0.000562 | 0.984399 |
| Title | Cluster Plot | Dendrogram | e-value | e-value | e-value | Condition | Condition FDR | Condition Difference |
|---|---|---|---|---|---|---|---|---|
| Phatr_hclust_0348 |
 |
 |
0.17 |
550 |
530 |
RedLight_0.5h | 0.024837 | 1.00513 |
| Title | Cluster Plot | Dendrogram | e-value | e-value | e-value | Condition | Condition FDR | Condition Difference |
|---|---|---|---|---|---|---|---|---|
| Phatr_hclust_0372 |
 |
 |
2.3 |
16 |
4.8 |
GreenLight_0.5h | 0.002419 | 1.00509 |
| Title | Cluster Plot | Dendrogram | e-value | e-value | e-value | Condition | Condition FDR | Condition Difference |
|---|---|---|---|---|---|---|---|---|
| Phatr_hclust_0328 |
 |
 |
23 |
57 |
110 |
GreenLight_0.5h | 0.001304 | 1.0048 |
| Title | Cluster Plot | Dendrogram | e-value | e-value | e-value | Condition | Condition FDR | Condition Difference |
|---|---|---|---|---|---|---|---|---|
| Phatr_hclust_0311 |
 |
 |
4.3 |
3.3 |
13 |
BlueLight_0.5h | 0.025000 | 1.00453 |
| Title | Cluster Plot | Dendrogram | e-value | e-value | e-value | Condition | Condition FDR | Condition Difference |
|---|---|---|---|---|---|---|---|---|
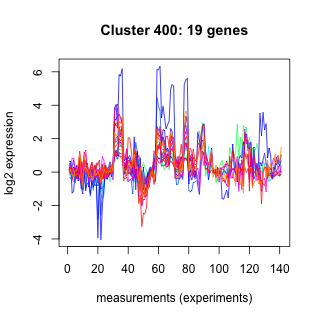
| Phatr_hclust_0400 |
 |
 |
5.9 |
1900 |
880 |
RedLight_24h | 0.000943 | 1.00419 |
| Title | Cluster Plot | Dendrogram | e-value | e-value | e-value | Condition | Condition FDR | Condition Difference |
|---|---|---|---|---|---|---|---|---|
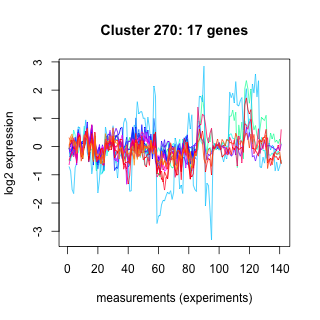
| Phatr_hclust_0270 |
 |
 |
0.98 |
1200 |
1700 |
Mixture_SH | 0.003763 | 1.0029 |
| Title | Cluster Plot | Dendrogram | e-value | e-value | e-value | Condition | Condition FDR | Condition Difference |
|---|---|---|---|---|---|---|---|---|
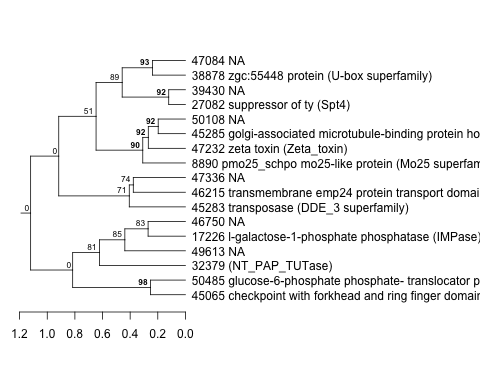
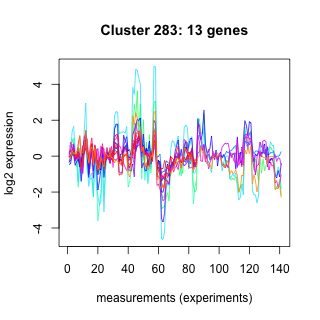
| Phatr_hclust_0283 |
 |
 |
0.66 |
1.6 |
450 |
Mixture_SH | 0.009112 | 1.0016 |
| Title | Cluster Plot | Dendrogram | e-value | e-value | e-value | Condition | Condition FDR | Condition Difference |
|---|---|---|---|---|---|---|---|---|
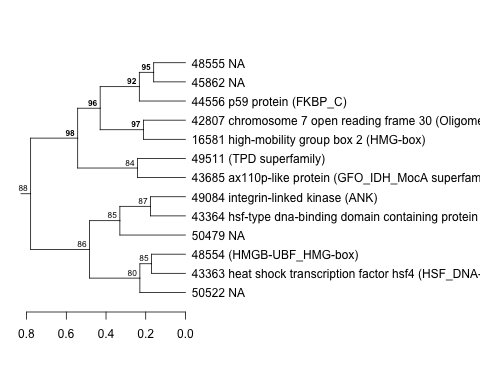
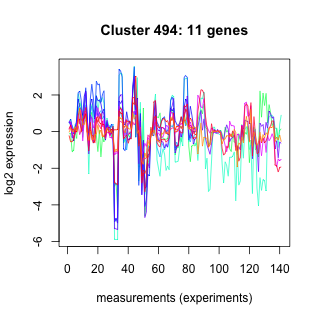
| Phatr_hclust_0494 |
 |
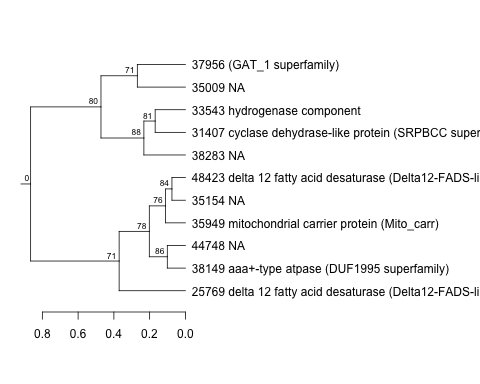 |
57 |
79 |
200 |
GreenLight_0.5h | 0.041799 | 1.00129 |
| Title | Cluster Plot | Dendrogram | e-value | e-value | e-value | Condition | Condition FDR | Condition Difference |
|---|---|---|---|---|---|---|---|---|
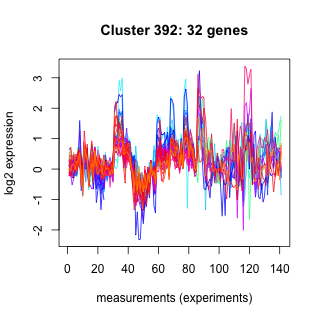
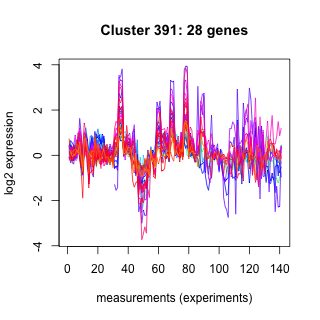
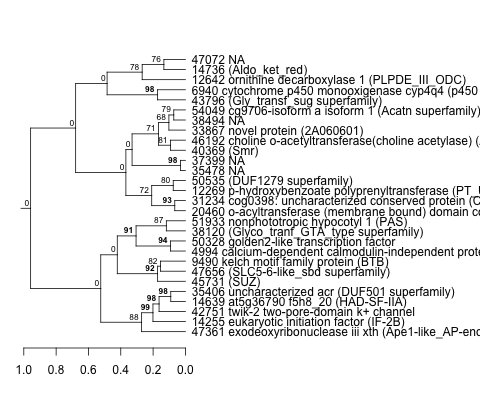
| Phatr_hclust_0392 |
 |
 |
0.000000000000026 |
140 |
480 |
Mixture_SH | 0.000357 | 1.00107 |
| Phatr_hclust_0392 |
|
|
0.000000000000026 |
140 |
480 |
Dark_treated | 0.032292 | 0.991085 |
| Title | Cluster Plot | Dendrogram | e-value | e-value | e-value | Condition | Condition FDR | Condition Difference |
|---|---|---|---|---|---|---|---|---|
| Thaps_hclust_0483 |
 |
 |
0.7 |
5 |
0.096 |
co2_elevated_stat_arrays | 0.000658 | 0.999 |
| Title | Cluster Plot | Dendrogram | e-value | e-value | e-value | Condition | Condition FDR | Condition Difference |
|---|---|---|---|---|---|---|---|---|
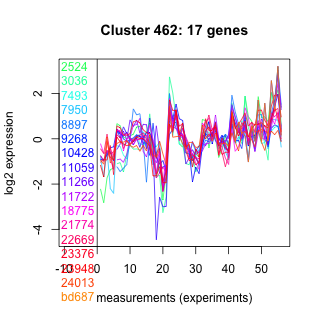
| Thaps_hclust_0462 |
 |
 |
0.0000000094 |
0.0000011 |
0.000046 |
diel_exponential_vs_stationary | 0.000602 | 0.998 |
| Title | Cluster Plot | Dendrogram | e-value | e-value | e-value | Condition | Condition FDR | Condition Difference |
|---|---|---|---|---|---|---|---|---|
| Phatr_hclust_0374 |
 |
 |
59 |
150 |
620 |
BlueLight_0.5h | 0.073188 | 0.997355 |
| Title | Cluster Plot | Dendrogram | e-value | e-value | e-value | Condition | Condition FDR | Condition Difference |
|---|---|---|---|---|---|---|---|---|
| Phatr_hclust_0422 |
 |
 |
0.14 |
0.64 |
0.66 |
Blue_vs_Red_6h | 0.015790 | 0.997193 |
| Title | Cluster Plot | Dendrogram | e-value | e-value | e-value | Condition | Condition FDR | Condition Difference |
|---|---|---|---|---|---|---|---|---|
| Phatr_hclust_0375 |
 |
 |
0.0003 |
13 |
210 |
BlueLight_0.5h | 0.027869 | 0.996953 |
| Title | Cluster Plot | Dendrogram | e-value | e-value | e-value | Condition | Condition FDR | Condition Difference |
|---|---|---|---|---|---|---|---|---|
| Phatr_hclust_0309 |
 |
 |
0.00052 |
5.7 |
25 |
RedLight_0.5h | 0.002358 | 0.996754 |
| Title | Cluster Plot | Dendrogram | e-value | e-value | e-value | Condition | Condition FDR | Condition Difference |
|---|---|---|---|---|---|---|---|---|
| Phatr_hclust_0234 |
 |
 |
0.046 |
1 |
1.9 |
BlueLight_0.5h | 0.003986 | 0.996742 |
| Title | Cluster Plot | Dendrogram | e-value | e-value | e-value | Condition | Condition FDR | Condition Difference |
|---|---|---|---|---|---|---|---|---|
| Phatr_hclust_0005 |
 |
 |
0.00000067 |
0.000017 |
0.000073 |
Ammonia_SH | 0.000345 | 0.996538 |
| Title | Cluster Plot | Dendrogram | e-value | e-value | e-value | Condition | Condition FDR | Condition Difference |
|---|---|---|---|---|---|---|---|---|
| Phatr_hclust_0252 |
 |
 |
750 |
2500 |
190 |
GreenLight_0.5h | 0.010784 | 0.996341 |
| Phatr_hclust_0252 |
|
|
750 |
2500 |
190 |
BlueLight_0.5h | 0.039529 | 0.99143 |
| Title | Cluster Plot | Dendrogram | e-value | e-value | e-value | Condition | Condition FDR | Condition Difference |
|---|---|---|---|---|---|---|---|---|
| Thaps_hclust_0071 |
 |
 |
0.0000019 |
0.0000028 |
0.00008 |
diel_exponential_vs_stationary | 0.000602 | 0.995 |
| Title | Cluster Plot | Dendrogram | e-value | e-value | e-value | Condition | Condition FDR | Condition Difference |
|---|---|---|---|---|---|---|---|---|
| Phatr_hclust_0303 |
 |
 |
0.000000000035 |
80 |
400 |
BlueLight_0.5h | 0.003676 | 0.99479 |
| Title | Cluster Plot | Dendrogram | e-value | e-value | e-value | Condition | Condition FDR | Condition Difference |
|---|---|---|---|---|---|---|---|---|
| Thaps_hclust_0219 |
 |
 |
2.8e-16 |
0.0000000055 |
0.012 |
co2_elevated_stat_arrays | 0.000658 | 0.994 |
| Title | Cluster Plot | Dendrogram | e-value | e-value | e-value | Condition | Condition FDR | Condition Difference |
|---|---|---|---|---|---|---|---|---|
| Thaps_hclust_0499 |
 |
 |
0.13 |
5.4 |
18 |
highlight_arrays | 0.000442 | 0.993 |
| Title | Cluster Plot | Dendrogram | e-value | e-value | e-value | Condition | Condition FDR | Condition Difference |
|---|---|---|---|---|---|---|---|---|
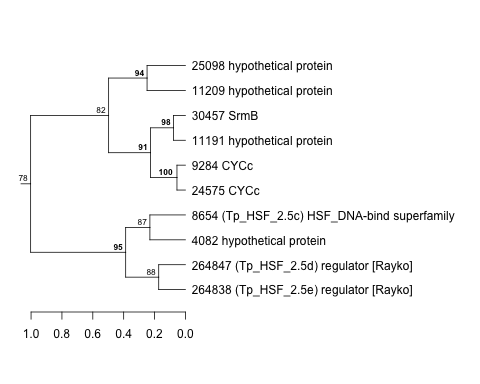
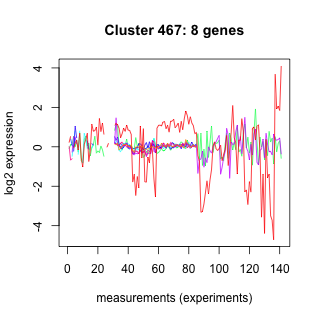
| Phatr_hclust_0467 |
 |
 |
1100 |
3200 |
3700 |
Simazine_SH | 0.000424 | 0.992757 |
| Title | Cluster Plot | Dendrogram | e-value | e-value | e-value | Condition | Condition FDR | Condition Difference |
|---|---|---|---|---|---|---|---|---|
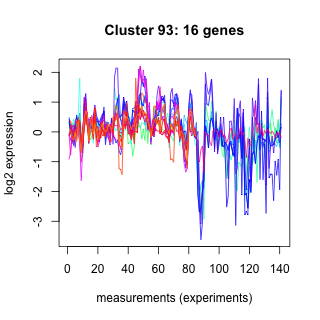
| Phatr_hclust_0093 |
 |
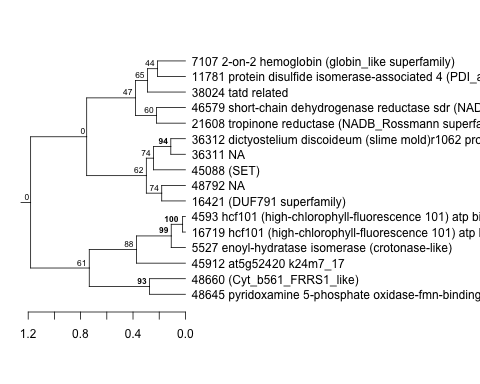 |
0.27 |
0.5 |
1 |
light_10.5hr | 0.002273 | 0.991901 |
| Title | Cluster Plot | Dendrogram | e-value | e-value | e-value | Condition | Condition FDR | Condition Difference |
|---|---|---|---|---|---|---|---|---|
| Phatr_hclust_0453 |
 |
 |
220 |
310 |
370 |
Silver_SH | 0.002101 | 0.99075 |
| Phatr_hclust_0453 |
|
|
220 |
310 |
370 |
Salinity_15ppt_SH | 0.011111 | 0.984687 |
| Title | Cluster Plot | Dendrogram | e-value | e-value | e-value | Condition | Condition FDR | Condition Difference |
|---|---|---|---|---|---|---|---|---|
| Phatr_hclust_0229 |
 |
 |
4 |
85 |
200 |
Re-illuminated_0.5h | 0.033073 | 0.990466 |
| Title | Cluster Plot | Dendrogram | e-value | e-value | e-value | Condition | Condition FDR | Condition Difference |
|---|---|---|---|---|---|---|---|---|
| Phatr_hclust_0419 |
 |
 |
75 |
170 |
220 |
light_16hr_dark_30min | 0.037415 | 0.99015 |
| Title | Cluster Plot | Dendrogram | e-value | e-value | e-value | Condition | Condition FDR | Condition Difference |
|---|---|---|---|---|---|---|---|---|
| Phatr_hclust_0245 |
 |
 |
4.2 |
3.7 |
150 |
Re-illuminated_0.5h | 0.012722 | 0.98972 |
| Title | Cluster Plot | Dendrogram | e-value | e-value | e-value | Condition | Condition FDR | Condition Difference |
|---|---|---|---|---|---|---|---|---|
| Phatr_hclust_0129 |
 |
 |
0.00000098 |
20 |
160 |
Ammonia_SH | 0.000345 | 0.989153 |
| Title | Cluster Plot | Dendrogram | e-value | e-value | e-value | Condition | Condition FDR | Condition Difference |
|---|---|---|---|---|---|---|---|---|
| Phatr_hclust_0380 |
 |
 |
66 |
0.79 |
610 |
BlueLight_0.5h | 0.010938 | 0.989025 |
| Title | Cluster Plot | Dendrogram | e-value | e-value | e-value | Condition | Condition FDR | Condition Difference |
|---|---|---|---|---|---|---|---|---|
| Thaps_hclust_0222 |
 |
 |
0.0000000000016 |
0.000000011 |
0.0008 |
co2_elevated_stat_arrays | 0.000658 | 0.989 |
| Title | Cluster Plot | Dendrogram | e-value | e-value | e-value | Condition | Condition FDR | Condition Difference |
|---|---|---|---|---|---|---|---|---|
| Thaps_hclust_0330 |
 |
 |
0.0000058 |
0.00000085 |
0.000041 |
highlight_arrays | 0.000442 | 0.989 |
| Title | Cluster Plot | Dendrogram | e-value | e-value | e-value | Condition | Condition FDR | Condition Difference |
|---|---|---|---|---|---|---|---|---|
| Phatr_hclust_0490 |
 |
 |
0.00082 |
4.6 |
89 |
BlueLight_0.5h | 0.039844 | 0.988194 |
| Title | Cluster Plot | Dendrogram | e-value | e-value | e-value | Condition | Condition FDR | Condition Difference |
|---|---|---|---|---|---|---|---|---|
| Thaps_hclust_0247 |
 |
 |
8.7e-16 |
0.00000000045 |
0.0000019 |
BaP | 0.000370 | 0.988 |
| Title | Cluster Plot | Dendrogram | e-value | e-value | e-value | Condition | Condition FDR | Condition Difference |
|---|---|---|---|---|---|---|---|---|
| Phatr_hclust_0202 |
 |
 |
0.00079 |
0.84 |
20 |
GreenLight_0.5h | 0.000459 | 0.987851 |
| Title | Cluster Plot | Dendrogram | e-value | e-value | e-value | Condition | Condition FDR | Condition Difference |
|---|---|---|---|---|---|---|---|---|
| Thaps_hclust_0082 |
 |
|
8.89825e-43 |
2e-27 |
1.3e-16 |
lowFe_KTKB_Day3 | 0.000862 | 0.987 |
| Title | Cluster Plot | Dendrogram | e-value | e-value | e-value | Condition | Condition FDR | Condition Difference |
|---|---|---|---|---|---|---|---|---|
| Thaps_hclust_0112 |
 |
 |
0.00000035 |
0.017 |
0.34 |
BaP | 0.000370 | 0.987 |
| Title | Cluster Plot | Dendrogram | e-value | e-value | e-value | Condition | Condition FDR | Condition Difference |
|---|---|---|---|---|---|---|---|---|
| Phatr_hclust_0485 |
 |
 |
0.00015 |
3400 |
92 |
light_6hr | 0.000562 | 0.985851 |
| Title | Cluster Plot | Dendrogram | e-value | e-value | e-value | Condition | Condition FDR | Condition Difference |
|---|---|---|---|---|---|---|---|---|
| Phatr_hclust_0108 |
 |
 |
0.0000000023 |
7 |
430 |
light_16hr_dark_30min | 0.000735 | 0.985804 |
| Title | Cluster Plot | Dendrogram | e-value | e-value | e-value | Condition | Condition FDR | Condition Difference |
|---|---|---|---|---|---|---|---|---|
| Thaps_hclust_0380 |
 |
 |
1.1 |
5 |
8.7 |
lowSi_TMEVA | 0.023200 | 0.984 |
| Title | Cluster Plot | Dendrogram | e-value | e-value | e-value | Condition | Condition FDR | Condition Difference |
|---|---|---|---|---|---|---|---|---|
| Phatr_hclust_0489 |
 |
 |
5.8 |
940 |
32 |
Re-illuminated_0.5h | 0.034615 | 0.983258 |
| Title | Cluster Plot | Dendrogram | e-value | e-value | e-value | Condition | Condition FDR | Condition Difference |
|---|---|---|---|---|---|---|---|---|
| Phatr_hclust_0351 |
 |
 |
0.81 |
25 |
220 |
RedLight_6h | 0.000694 | 0.98256 |
| Title | Cluster Plot | Dendrogram | e-value | e-value | e-value | Condition | Condition FDR | Condition Difference |
|---|---|---|---|---|---|---|---|---|
| Phatr_hclust_0231 |
 |
 |
3 |
44 |
980 |
Re-illuminated_0.5h | 0.029255 | 0.982008 |
| Title | Cluster Plot | Dendrogram | e-value | e-value | e-value | Condition | Condition FDR | Condition Difference |
|---|---|---|---|---|---|---|---|---|
| Phatr_hclust_0107 |
 |
 |
62 |
980 |
2000 |
light_16hr_dark_4hr | 0.000943 | 0.981141 |
| Title | Cluster Plot | Dendrogram | e-value | e-value | e-value | Condition | Condition FDR | Condition Difference |
|---|---|---|---|---|---|---|---|---|
| Phatr_hclust_0432 |
 |
 |
3.9 |
4 |
5.1 |
Re-illuminated_0.5h | 0.024862 | 0.981076 |
| Title | Cluster Plot | Dendrogram | e-value | e-value | e-value | Condition | Condition FDR | Condition Difference |
|---|---|---|---|---|---|---|---|---|
| Phatr_hclust_0272 |
 |
 |
8.2 |
240 |
360 |
light_10.5hr | 0.011111 | 0.978473 |
| Title | Cluster Plot | Dendrogram | e-value | e-value | e-value | Condition | Condition FDR | Condition Difference |
|---|---|---|---|---|---|---|---|---|
| Phatr_hclust_0248 |
 |
 |
1900 |
110 |
3000 |
Mixture_SH | 0.000357 | 0.978083 |
| Title | Cluster Plot | Dendrogram | e-value | e-value | e-value | Condition | Condition FDR | Condition Difference |
|---|---|---|---|---|---|---|---|---|
| Phatr_hclust_0387 |
 |
 |
0.019 |
190 |
230 |
BlueLight_0.5h | 0.042010 | 0.977077 |
| Title | Cluster Plot | Dendrogram | e-value | e-value | e-value | Condition | Condition FDR | Condition Difference |
|---|---|---|---|---|---|---|---|---|
| Phatr_hclust_0391 |
 |
 |
0.0000038 |
0.48 |
5.6 |
RedLight_0.5h | 0.002804 | 0.976575 |