Organism : Desulfovibrio vulgaris Hildenborough
| Module List :


DVU1580
ribose 5-phosphate isomerase
Functional Annotations (8)
| Function | System |
|---|---|
| Ribose 5-phosphate isomerase RpiB | cog/ cog |
| ribose-5-phosphate isomerase activity | go/ molecular_function |
| pentose-phosphate shunt | go/ biological_process |
| Pentose phosphate pathway | kegg/ kegg pathway |
| Metabolic pathways | kegg/ kegg pathway |
| Biosynthesis of secondary metabolites | kegg/ kegg pathway |
| Microbial metabolism in diverse environments | kegg/ kegg pathway |
| rpiB_lacA_lacB | tigr/ tigrfam |
 Module member
  Regulator
  Motif
Motif
Regulation information for DVU1580
(Mouseover regulator name to see its description)
| Regulator | Module | Operator |
|---|---|---|
| DVU0110 | 57 | tf |
| DVU0309 | 57 | tf |
| DVU0619 | 57 | tf |
| DVU0813 | 57 | tf |
| DVU0813 DVU0230 |
57 | combiner |
| DVU0813 DVU1745 |
57 | combiner |
| DVU0854 | 57 | tf |
| DVU0854 DVU3111 |
57 | combiner |
| DVU1518 DVU0813 |
57 | combiner |
| DVU1628 DVU0813 |
57 | combiner |
| DVU1788 | 57 | tf |
| DVU2086 | 57 | tf |
| DVU2567 DVU0813 |
57 | combiner |
| DVU2644 | 57 | tf |
| DVU0653 | 294 | tf |
| DVU0682 DVU1949 |
294 | combiner |
| DVU0854 DVU0682 |
294 | combiner |
| DVU0854 DVU2275 |
294 | combiner |
| DVU1584 DVU0653 |
294 | combiner |
| DVU2394 DVU2832 |
294 | combiner |
| DVU2423 DVU2832 |
294 | combiner |
| DVU3167 | 294 | tf |
Motif information (de novo identified motifs for modules)
There are 4 motifs predicted.
Click on the RegPredict links to explore the motif in RegPredict.
| Motif Id | e-value | Consensus | Motif Logo | RegPredict |
|---|---|---|---|---|
| 111 | 2.40e-01 | caCcaccGatGttatAcGGaAagC |
 |
RegPredict |
| 112 | 1.40e+02 | TtgTC.GGGGTgGC |
|
RegPredict |
| 563 | 9.90e-01 | a.gtctTaTatttcTcc.T.ttat |
|
RegPredict |
| 564 | 5.40e+00 | cCtgAAAaaCa |
|
RegPredict |
Functional Enrichment for DVU1580
| Function | System |
|---|---|
| Ribose 5-phosphate isomerase RpiB | cog/ cog |
| ribose-5-phosphate isomerase activity | go/ molecular_function |
| pentose-phosphate shunt | go/ biological_process |
| Pentose phosphate pathway | kegg/ kegg pathway |
| Metabolic pathways | kegg/ kegg pathway |
| Biosynthesis of secondary metabolites | kegg/ kegg pathway |
| Microbial metabolism in diverse environments | kegg/ kegg pathway |
| rpiB_lacA_lacB | tigr/ tigrfam |
Module neighborhood information for DVU1580
| Gene | Common Name | Description | Module membership |
|---|---|---|---|
| DVU0159 | thioesterase family protein | 57, 119 | |
| DVU0160 | carbohydrate isomerase KpsF/GutQ family protein | 57, 119 | |
| DVU0243 | lipoprotein | 57, 119 | |
| DVU0417 | speA | arginine decarboxylase | 57, 119 |
| DVU0483 | DNA mismatch repair protein MutL | 4, 57 | |
| DVU0785 | rodA | rod shape-determining protein RodA | 75, 294 |
| DVU0801 | uvrC | excinuclease ABC subunit C | 57, 110 |
| DVU0855 | radical SAM domain-containing protein | 57, 198 | |
| DVU0856 | hemB | delta-aminolevulinic acid dehydratase | 57, 227 |
| DVU0864 | glycoprotease family protein | 57, 227 | |
| DVU0982 | hypothetical protein DVU0982 | 57, 211 | |
| DVU0985 | hypothetical protein DVU0985 | 57, 110 | |
| DVU0989 | periplasmic divalent cation tolerance protein cutA | 57, 99 | |
| DVU1091 | hypothetical protein DVU1091 | 57, 223 | |
| DVU1191 | ATP-dependent protease La | 57, 227 | |
| DVU1193 | radC | DNA repair protein RadC | 57, 227 |
| DVU1214 | dolichyl-phosphate-mannose-protein mannosyltransferase family protein | 65, 294 | |
| DVU1281 | hypothetical protein DVU1281 | 95, 294 | |
| DVU1380 | hypothetical protein DVU1380 | 57, 226 | |
| DVU1381 | hypothetical protein DVU1381 | 57, 226 | |
| DVU1383 | hypothetical protein DVU1383 | 57, 167 | |
| DVU1401 | hypothetical protein DVU1401 | 57, 211 | |
| DVU1432 | radical SAM domain-containing protein | 57, 227 | |
| DVU1434 | hypothetical protein DVU1434 | 57, 63 | |
| DVU1466 | argB | acetylglutamate kinase | 13, 57 |
| DVU1580 | ribose 5-phosphate isomerase | 57, 294 | |
| DVU1581 | hypothetical protein DVU1581 | 141, 294 | |
| DVU1583 | hypothetical protein | 282, 294 | |
| DVU1585 | vitamin B12-dependent methionine synthase | 12, 294 | |
| DVU1586 | thioredoxin family protein | 292, 294 | |
| DVU1588 | hpt | hypoxanthine phosphoribosyltransferase | 215, 294 |
| DVU1589 | hypothetical protein DVU1589 | 12, 294 | |
| DVU1769 | hydA | periplasmic | 176, 294 |
| DVU1770 | hydB | periplasmic | 137, 294 |
| DVU1866 | hypothetical protein DVU1866 | 292, 294 | |
| DVU1978 | Na+/H+ antiporter family protein | 223, 294 | |
| DVU2024 | hypothetical protein DVU2024 | 273, 294 | |
| DVU2026 | hypothetical protein DVU2026 | 273, 294 | |
| DVU2031 | hypothetical protein DVU2031 | 273, 294 | |
| DVU2037 | cobS protein | 273, 294 | |
| DVU2261 | hypothetical protein DVU2261 | 57, 309 | |
| DVU2621 | hypothetical protein DVU2621 | 57, 226 | |
| DVU2639 | hypothetical protein DVU2639 | 57, 63 | |
| DVU2909 | MarR family transcriptional regulator | 57, 261 | |
| DVU3100 | biopolymer ExbD/TolR family transporter | 44, 294 | |
| DVU3202 | TatD family hydrolase | 57, 261 | |
| DVU3283 | hypothetical protein DVU3283 | 4, 57 | |
| DVU3314 | U32 family peptidase | 57, 100 | |
| DVU3357 | hypothetical protein DVU3357 | 57, 226 | |
| DVU3358 | ParA family protein | 57, 226 | |
| DVU3359 | hypothetical protein DVU3359 | 57, 63 |
Gene Page Help
Network Tab
If the gene is associated with a module(s), its connection to given modules along with other members of that module are shown as network by using CytoscapeWeb. In this view, each green colored circular nodes represent module member genes, purple colored diamonds represent module motifs and red triangles represent regulators. Each node is connected to module (Bicluster) via edges. This representation provides quick overview of all genes, regulators and motifs for modules. It also allows one to see shared genes/motifs/regulators among diferent modules.
Network representation is interactive. You can zoom in/out and move nodes/edges around. Clicking on a node will open up a window to give more details. For genes, Locus tag, organism, genomic coordinates, NCBI gene ID, whether it is transcription factor or not and any associated functional information will be shown. For regulators, number of modules are shown in addition to gene details. For motifs, e-value, consensus sequence and sequence logo will be shown. For modules, expression profile plot, motif information, functional associations and motif locations for each member of the module will be shown.
You can pin information boxes by using button in the box title and open up additional ones on the same screen for comparative analysis.
Regulation Tab
Regulation tab for each gene includes regulatory influences such as environmental factors or transcription factors or their combinations identified by regulatory network inference algorithms.
If the gene is a member of a module, regulators influencing that module are also considered to regulate the gene. Regulators table list total number of regulatory influences, regulators, modules and type of the influence.
You can see description of the regulator inside the tooltip when you mouseover. In certain cases the regulatory influence is predicted to be the result of the combination of two influences. These are indicated as combiner in the column labeled "Operator".
For transcription factors, an additional table next to regulator table will be show. This table show modules that are influenced by the transcription factor.
Motifs Tab
Network inference algorithm uses de novo motif prediction for assigning genes to modules. If there are any motifs identified in the upstream region of a gene, the motif will be shown here. For each motif sequence logo, consensus and e-value will be shown.
Functions Tab
Identification of functional enrichment for the module members is important in associating predicted motifs and regulatory influences with pathways. As described above, the network inference pipeline includes a functional enrichment module by which hypergeometric p-values are used to identify over representation of functional ontology terms among module members.
Network Portal presents functional ontologies from KEGG, GO, TIGRFAM, and COG as separate tables that include function name, type, corrected and uncorrected hypergeometric p-values, and the number of genes assigned to this category out of total number of genes in the module.
Module Members Tab
Identity of gene members in a module may help to identify potential interactions between different functional modules. Therefore, neighbor genes that share the same module(s) with gene under consideration are shown here. For each memebr, gene name, description and modules that contain it are listed.
Help Tab
This help page. More general help can be accessed by clicking help menu in the main navigation bar.
CircVis
Our circular module explorer is adapted from visquick originally developed by Dick Kreisberg of Ilya Shmulevich lab at ISB for The Cancer Genome Atlas. We use simplified version of visquick to display distribution of module members and their interactions across the genome. This view provides summary of regulation information for a gene. The main components are;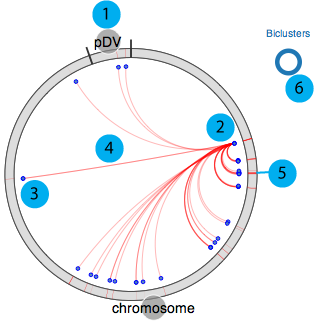
- 1. All genomic elements for the organism are represented as a circle and each element is separated by black tick marks. In this example chromosome and pDV represent main chromosome and plasmid for D. vulgaris Hildenborough, respectively.
- 2. Source gene
- 3. Target genes (other module members)
- 4. Interactions between source and target genes for a particular module
- 5. Module(s) that source gene and target genes belong to
- 6. Visualisation legend
Comments for DVU1580
Please add your comments for this gene by using the form below. Your comments will be publicly available.comments powered by Disqus
Social Tab
Network Portal is designed to promote collaboration through social interactions. Therefore interested researchers can share information, questions and updates for a particular gene.
Users can use their Disqus, Facebook, Twitter or Google accounts to connect to this page (We recommend Google). Each module and gene page includes comments tab that lists history of the interactions for that gene. You can browse the history, make updates, raise questions and share these activities with social web.
In the next releases of the network portal, we are planning to create personal space for each user where you can share you space that contains all the analysis steps you did along with relevant information.