
Help
Welcome to MTB Network Portal Help pages.
Please select an option from the navigation menu on the left.
You can also find instant help on individual pages by clicking on the icon.
 |
|
Software Help |
Chromegoose Help |
MTB Network Portal team
Genes Table
Genes page will display table of Mycobacterium tuberculosis H37Rv genes. Genome annotations are mainly derived from Tuberculist . Locus name is linked to individual gene pages that include more detailed information. Various filters can be used to pinpoint gene of interest.
Table Columns
- Locus: Locus tag of the gene linked to detailed gene page
- Symbol: Gene Symbol if available.
- Cholesterol Essential: Indicates if the gene is found to be essential for in vitro growth on Cholesterol. Reference:Griffin JE, Gawronski JD, Dejesus MA, Ioerger TR, Akerley BJ, Sassetti CM, High-resolution phenotypic profiling defines genes essential for mycobacterial growth and cholesterol catabolism. PLoS Pathog (2011) 7(9):e1002251
- Griffin Essential: Essentiality score of in vitro growth. Reference:Griffin JE, Gawronski JD, Dejesus MA, Ioerger TR, Akerley BJ, Sassetti CM, High-resolution phenotypic profiling defines genes essential for mycobacterial growth and cholesterol catabolism. PLoS Pathog (2011) 7(9):e1002251
- Bound by: This column will list number of TF(s) that were found to bind to upstream of the given gene in ChIP-Seq experiments. Reference: Minch KJ, Rustad TR, Peterson EJR, et al. "The DNA-binding network of Mycobacterium tuberculosis." Nat Commun. 2015;6:5829
- Binds To: If the gene is a TF, this column will list number of target genes that it binds to as identified in ChIP-Seq experiments. Reference: Minch KJ, Rustad TR, Peterson EJR, et al. "The DNA-binding network of Mycobacterium tuberculosis." Nat Commun. 2015;6:5829
Filters:
Genes table can be further filtered by number of criteria. Multiple filters can be combined to create more specific queries. Sorting can also be changed based on different parameters. Simply select filters you want to apply, select sorting method and press "Apply".Reference: Griffin JE, Gawronski JD, Dejesus MA, Ioerger TR, Akerley BJ, Sassetti CM, High-resolution phenotypic profiling defines genes essential for mycobacterial growth and cholesterol catabolism. PLoS Pathog (2011) 7(9):e1002251
Reference: Minch KJ, Rustad TR, Peterson EJR, et al. "The DNA-binding network of Mycobacterium tuberculosis." Nat Commun. 2015;6:5829
Modules Table
Regulatory units (modules) are identified by using cMonkey algorithm. More specifically, module or bicluster refers to set of genes that are conditionally co-regulated under subset of the conditions. Identification of modules integrates co-expression, de-novo motif identification, and other functional associations such as operon information and protein-protein interactions.
Columns:
- Title: Name of the regulatory module/bicluster identified by cMonkey and linked to module details page
- Residual: is a measure of bicluster quality. Mean bicluster residual is smaller when the expression profile of the genes in the module is "tighter". So smaller residuals are usually indicative of better bicluster quality.
- Score: Bicluster score.
- Motif 1 and 2: cMonkey integrates powerful de novo motif detection to identify conditionally co-regulated sets of genes. For each module 2 de novo predicted motifs are listed in the module page as motif logo images. Click on the image will show larger motif logo
- Motif 1 and 2 e-values: Motif e-value is an indicative of the motif co-occurences between the members of the module. Smaller e-values are indicative of significant sequence motifs. Our experience showed that e-values smaller than 10 are generally indicative of significant motifs.
Filters: You can filter the rows in the table based on residual and motif e-values by using sliders.
Reference: Reiss, D. J., Baliga N. S., & Bonneau R. (2006). Integrated biclustering of heterogeneous genome-wide datasets for the inference of global regulatory networks. BMC bioinformatics. 7, 280
Regulators Table
Regulators page lists regulatory influences identified through Inferelator algorithm.
The Inferelator is an algorithm for infering predictive regulatory networks from gene expression data. It does so by selecting the regulators (transcription factors or environmental factors) whose levels are most predictive of each gene or bicluster's expression.
Columns
- Regulator Locus: Locus tag of the TF and its product linked to gene page
- Interaction: Direction of the regulatory influence identified. up-regulates vs down-regulates
- Target Bicluster: Bicluster predicted to be regulated by given TF. Link will take you to the module page.
- Weight: Weight of the regulatory influence. It can be positive (up-regulates) or negative (down-regulates). Higher absolute value of the weight is associated with confidence of the influence prediction.
- Regulator Taxonomy: List all other modules that are predicted to be regulated by the same TF.
Filters: Regulators table can be further filtered by searching for a specific Regulator, Interaction or weight.
Reference: Bonneau R, Reiss DJ, Shannon P, Facciotti M, Hood L, Baliga NS, Thorsson V. The Inferelator: an algorithm for learning parsimonious regulatory networks from systems-biology data sets de novo. Genome Biol. 2006;7(5):R36
Motifs Table
Transcription factor binding motifs help to elucidate regulatory mechanism. cMonkey integrates powerful de novo motif detection to identify conditionally co-regulated sets of genes. De novo predicted motifs for each module are listed in the module page as motif logo images along with associated prediction statistics (e-values).
Columns:
- Title: Name of the regulatory motif identified by cMonkey and linked to motif's details page
- Logo: is a graphical representation of the sequence conservation of DNA
- e-value: Motif e-value is an indicative of the motif co-occurences between the members of the module. Smaller e-values are indicative of significant sequence motifs. Our experience showed that e-values smaller than 10 are generally indicative of significant motifs.
- Number of sites: Number of genes in a given module that includes identified motif in the upstream region
- Length: Number of nucleotide bases in the motif logo
- Motif Bicluster: Regulatory module/bicluster that includes given motif.
- : Clicking on the icon will display detailed motif information in an overlay window.
Reference: Reiss, D. J., Baliga N. S., & Bonneau R. (2006). Integrated biclustering of heterogeneous genome-wide datasets for the inference of global regulatory networks. BMC bioinformatics. 7, 280
ChIP-Seq Data
This page provides a gateway for all available ChIP-Seq data and associated analyses results. ChIP-Seq Data was described in Minch et al. 2015, Nature Communicaions. Data is summarized in 3 different tables with appropriate links to gene/TF pages and ChIP-Seq Profiles.
ChIP-Seq Profiles
ChIP-Seq profiles table enables quick display of ChIP-Seq tracks in UCSC Genme Browser. Results are paginated for easy browsing with link to all the results at the lower left corner.- Regulator: ChIP-Seq TF used in the experimet
- UCSC Browser Tracks: Displays ChIp-Seq wiggle tracks in UCSC Genome browser in an overlay window
ChIP-Seq Data Files
ChIP_Seq Data Table lists summary information and download links for each ChIP-Seq data file. Similar to ChIP-Seq Profiles table, results are paginated for easy browsing with link to all the results at the lower left corner.- Title: Experiment specific ID linked to detailed experimental information.
- Data Locus: Link to gene page for TF used in the experiment
- Data Format: Format of the data file is shown. In this case ChIP-Seq data is coming from Sorted and indexed BAM sequencing results.
- Download: Provides a direct link to dta file
ChIP-Seq Binding Table
Table summarizing TF binding locations for target genes from ChIP-seq experiments, expression levels of these genes in the corresponding TF overexpression tiling array experiments.- ChIPSeq TF: Transcription factor used in ChIP-seq and tiling array experiments
- Gene Target: Gene with closest start to peak center
- Position/ChIP Center: nucleotide coordinate of nearest start/the peak's central location (unit = nucleotide position)
- Distance: Using "peak center," the nucleotide distance from the peak to the nearest start site
- Expression: log2 value describing differential expression of "gene" after induction of the corresponding "regulator" (See Rustad et al, 2014)
- Differential Expression: >1.5-fold change up ("induced") or down ("repressed") of target gene upon induction of the corresponding regulator (See Rustad et al, 2014)
- p-value: p-value of this level of enrichment calculated by empirical Bayes (See Rustad et al, 2014)
- Operon: Operon number
- Strand: peak strand
- Type: Type of the target gene locus
- Browser View: Link to UCSC browser view for the location of the peak
Reference: Minch KJ, Rustad TR, Peterson EJR, et al. "The DNA-binding network of Mycobacterium tuberculosis." Nat Commun. 2015;6:5829
Reference: Rustad TR, Minch KJ, Ma S, et al. "Mapping and manipulating the Mycobacterium tuberculosis transcriptome using a transcription factor overexpression-derived regulatory network." Genome Biol.. 2014;15(11):502.
TFOE Data

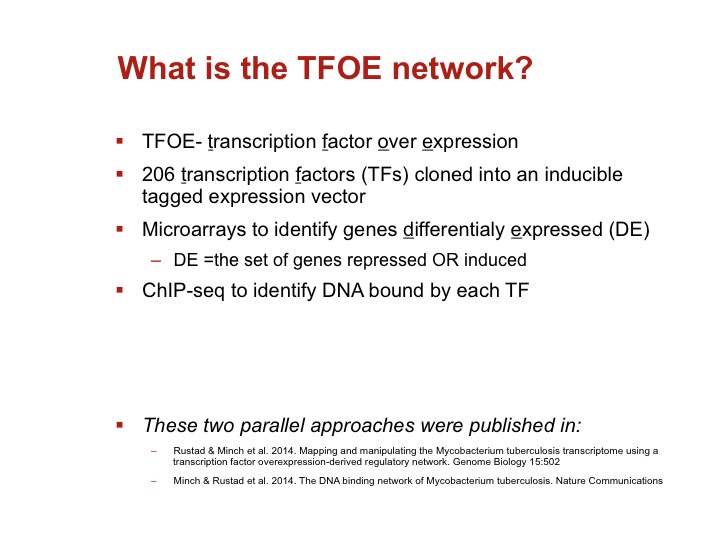
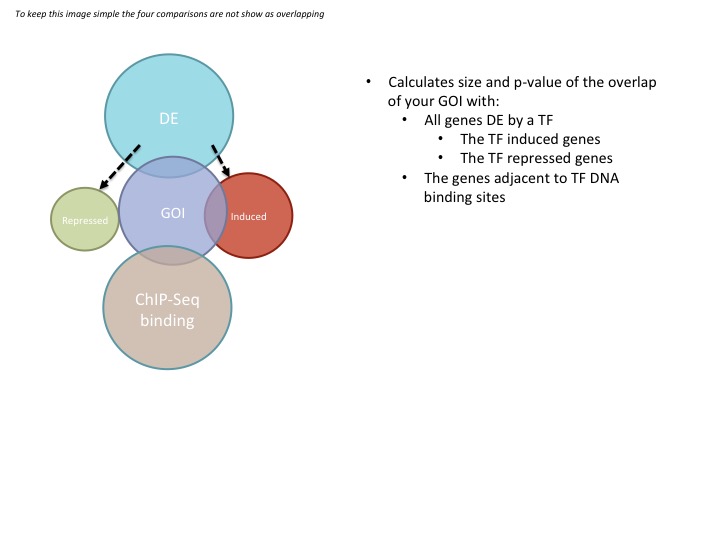
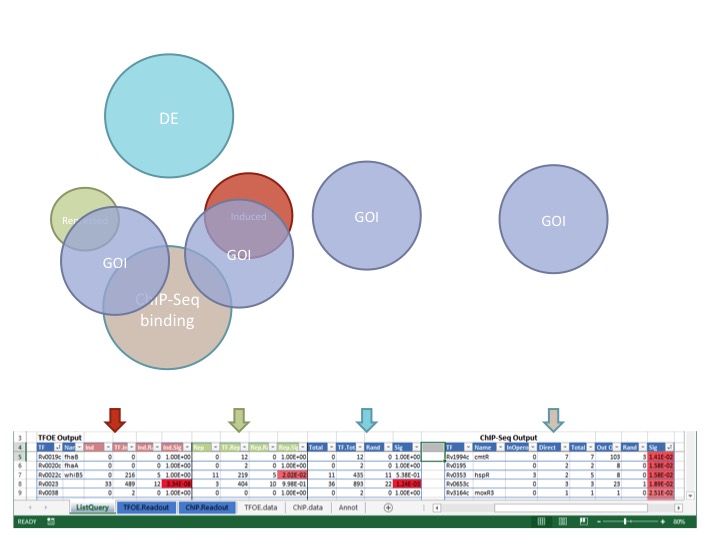
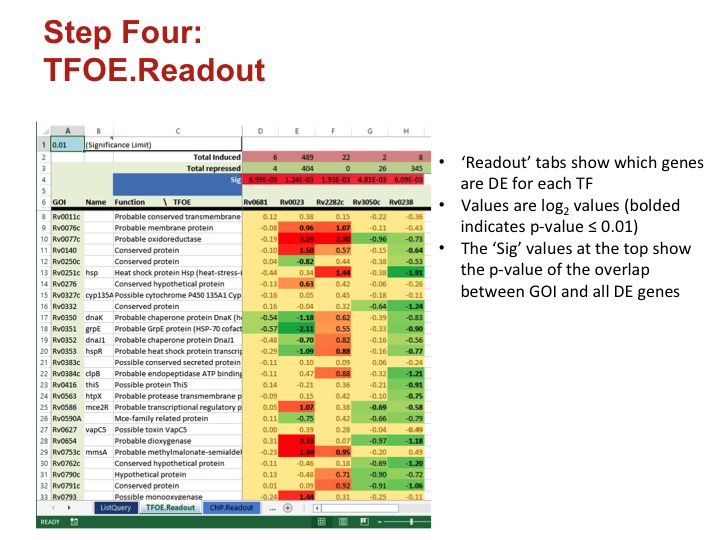
To investigate the MTB transcriptional landscape in a systematic manner, we developed a high-throughput approach to identify the genes controlled by nearly all predicted MTB TFs. We individually cloned and conditionally overexpressed 206 MTB TFs to induce the regulatory signature of each one. Using this approach we identified the sets of genes affected by TF overexpression (TFOE) and assembled them into an easily searchable map of transcriptional regulation in MTB.
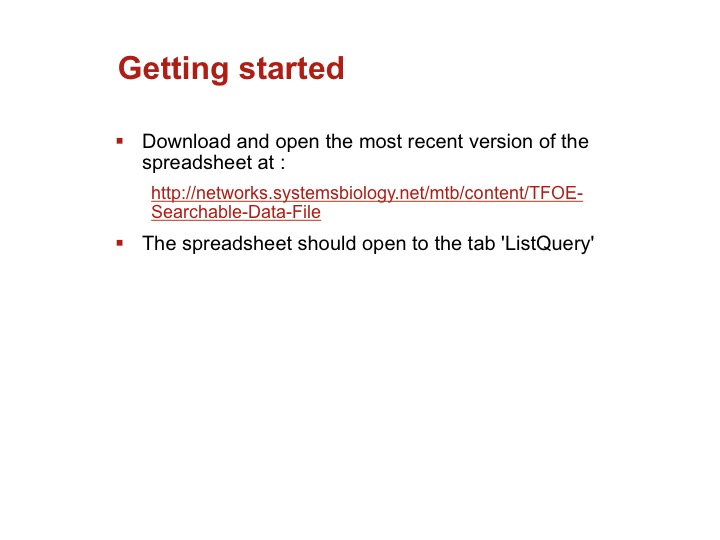
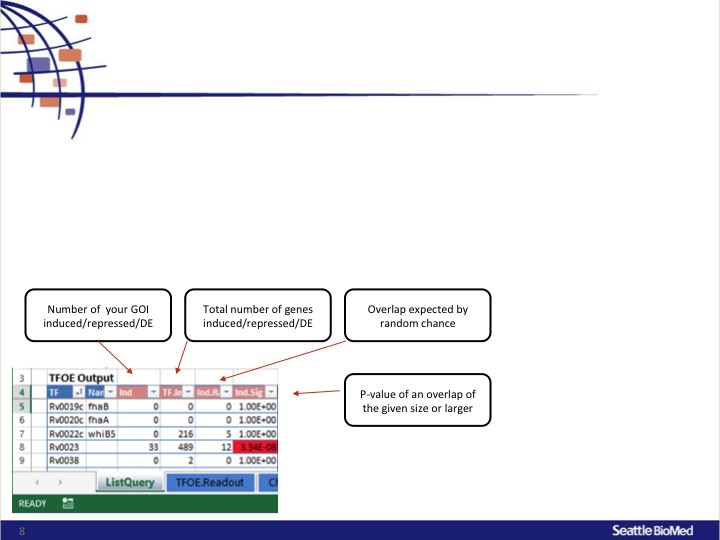
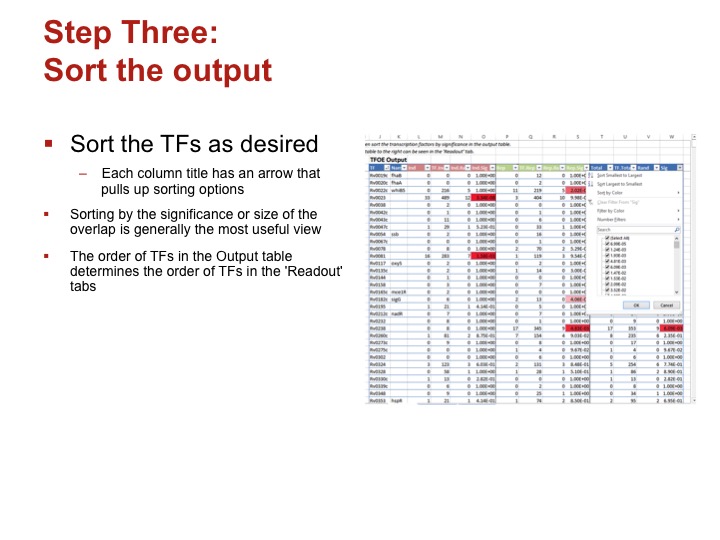
Accessing large datasets like the TFOE expression data can be difficult when the data spreads over thousands of genes and hundreds of regulators. To address the difficulties usually associated with accessing large data sets, we have designed a simple Excel spreadsheet for querying TFOE data to find regulators of specific genes or sets of genes. (Rustad et al. Genome Biol. 2014)
Gene Details Page
Gene Details page provides gene specific information from various resources in different panels. Sidebar on the left display quick links for easy access to other resources. Structure and Domains Block include UniProt entry links, PDB and PM Portal entries if available and Subcellular localization information. SSGCID Block displays entry for this in Seattle Structural Genomics Center for Infectious Diseases. If no entry is available user can submit request through their website. DNA and Amino acid sequences are also provided on this block.
Summary
Summary Panel shows basic genome annotation information for the gene such as Locus tag, symbol, Protein product description and genomic coordinates etc. If the gene is also a TF, this is indicated in the last column.Overview
Overview Panel summarizes regulatory information predicted through cMonkey algorithm by indicating regulatory modules containing this gene and associated motif and term enrichment information. Essentiality for in vitro growth on cholesterol is also indicated here.Binds To (ChIP-Seq)
If gene is a TF included in ChIP-Seq experiments, this panel will display list of genes whose coordinates found to be close to ChIP-seq binding peak coordinates. In addition to Distance from binding coordinate and genomic feature type of the target gene, differential expression and associated significance scores identified in TFOE experiments will also be shown here.Bound By (ChIP-Seq)
List of TF that were found to have binding peak close to genomic coordinates of this gene in ChIP-Seq experiments will be listed here together with differential expression and binding peak properties.Regulatory Modules (cMonkey Network)
This panel displays regulatory modules identified by cMonkey algorithm. For each module module name is linked to detailed information. For each module two de novo identified motifs are also listed together with associated motif logos and link to details page. Module residual which is a measure of bicluster quality is in the last colum. Mean bicluster residual is smaller when the expression profile of the genes in the module is "tighter". So smaller residuals are usually indicative of better bicluster quality.Regulated by (Inferelator Network)
This panel displays regulatory influences of TF as identified by using Inferelator algorithm. For each influence, name of the regulator, direction of the influence (up-regulates vs down-regulates) and influence weight are shown. Confidence of given influence relates to higher absolute values of the influence weights. Other influences column provides link to other predicted targets for the given regulator.Regulates (Inferelator Network)
If the gene is a TF and included in Inferelator network predictions, predicted target regulatory modules are displayed in this panel.Product Synonmys
Synonym names for the gene and its protein produs are listed.PATRIC
PATRIC Panel shows overview information from PATRIC (Pathosystems Resource Integration Center) such as PATRIC assigned Enzyme names, Pathway information and any available literature information. PATRIC Locus tag is linked to corresponding page in PATRIC.Tuberculist
Quick access to Tuberculist entry for the given gene is provided. Locus info will direct to Tuberculist page while Quickview opens corresponding page in an overlay window to provide a galnce of the TUberculist page. Genome view will display genomic neighborhood information from Tuberculist.KEGG Pathways
If gene has KEGG Pathway information link to specific pathway together with description of the KEGG Pathway and the number and links to other genes within the same pathway is shown in this panel.BioCyc Pathways
BioCyc is a collection of 5500 Pathway/Genome Databases (PGDBs), plus software tools for understanding their data. If gene is included in BioCyc, link to details page is shown. Cellular Overview Map will display the placement of the gene in the Cellular Overview Map in an overlay window.String Network
STRING is a database of known and predicted protein interactions.The interactions include direct (physical) and indirect (functional) associations. This panel will link gene to associated STRING entry and STring Network Column will display network of functional associations for the gene from STRING in an overlay window.RefSeq
RefSeq is a comprehensive, integrated, non-redundant, well-annotated set of reference sequences including genomic, transcript, and protein. RefSeq associated GI Number and Protein ID is displayed and linked to respective RefSeq pages. BLast column enables directly submitting this gene sequence as a query for Blast analysis. Conserved Domains column will enable similar analysis for the Conserved Domains database.Go Terms
Gene Ontology terms as provided by genome annotation are displayed. For each term, Term ID and Description is provided. Zoom icon will display more information about the GO Terms.Gene Expression
Gene Expression panel will link out to expression profile page for the given gene in TBDB database .SSGCID Details
SSGCID’s (Seattle Structural Genomics Center For Infectious Disease) primary mission is to determine the structure of ca. 70 protein targets from NIAID Category A-C agents, as well as emerging and re-emerging infectious disease organisms, each year for a period of five years. If structural information for the given gene is available, it will be displayed with summary information.Gene Expression Data
Gene Expression Data Panel currently display information and link to gene expression studies hosted at MTB Portal for Transcription Factor Overexpression Studies (See Rustad et al., 2014). For more details see Rustad et al. 2014. Genome BiologyChIP-Seq Profiles
If gene is a TF, ChIP-Seq profile information can be visualized as UCSC Genome Browser tracks in an overlay window. These binding profiles are collected from ChIP-Seq binding experiments performed by Minch et al. 2015. For more details see Minch et al. 2015. Nature ComunicationsEssentiality Panels
Gene Essentiality scores collected from several studies are visualized as barplots. Griffin Essential: Essentiality score of in vitro growth.in vitro essential: essentiality for in vitro growth (Griffin et al. 2011)
In vivo essential: essentiality identified by Himar1-based transposon mutagenesis (Sasetti et al., 2003)
- Griffin JE, Gawronski JD, Dejesus MA, Ioerger TR, Akerley BJ, Sassetti CM, High-resolution phenotypic profiling defines genes essential for mycobacterial growth and cholesterol catabolism. PLoS Pathog (2011) 7(9). - Sassetti CM, Boyd DH, Rubin EJ, Genes required for mycobacterial growth defined by high density mutagenesis. Mol Microbiol (2003) 48(1):77-84
Cholesterol Essentiality
Indicates if the gene is found to be essential for in vitro growth on Cholesterol. Whether the gene is essential or non-essential is displayed along with t-test p-value and Colesterol/Glycerol Ratio as described below.The relative representation of each mutant was determined by calculating the fold change (sequence reads/insertion in cholesterol divided by sequence reads/insertion in glycerol) for each gene. Statistical significance was determined by t-test. Each insertion site in each replicate sample was treated as a separate data point. The hyperbola used for defining genes specifically required for growth in cholesterol was defined by the formula, y = 3.8/x+0.7. Genes above this line are annotated as required for growth on cholesterol. - Griffin JE, Gawronski JD, Dejesus MA, Ioerger TR, Akerley BJ, Sassetti CM, High-resolution phenotypic profiling defines genes essential for mycobacterial growth and cholesterol catabolism. PLoS Pathog (2011) 7(9).
Module Detail Page
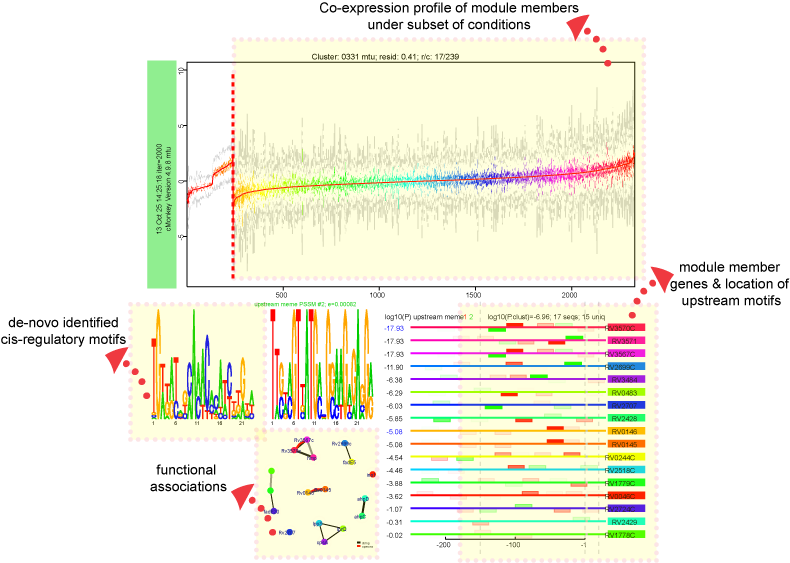
Regulatory module (bicluster) refers to set of genes that are conditionally co-regulated under subset of the conditions. Identification of modules integrates co-expression, de-novo motif identification, and other functional associations such as operon information and protein-protein interactions. Modules are based on cMonkey algorithm and Inferelator regulatory influences on these modules.
The landing module page shows quick summary info including co-expression profiles, de-novo identified motifs, and transcription factors as regulatory influences.
Expression Profiles :
Expression profiles is a plot of the expression ratios (log10) of the module's genes, over all subset of the conditions included in the module. The X-axis represent conditions and the Y-axis represents log10 expression ratios. Each gene is plotted as line plot with different colors. Colored legend for the lines are presented under the plot.Motifs:
De novo predicted motifs for each module are listed in the module page as motif logo images along with associated prediction statistics (e-values). The main module page also shows the location of these motifs within the upstream sequences of the module member genes.Motif Locations:
Location of the Identified motifs for the module in the upstream regions of the member genes are shown under the expression profiles plot. This plot shows the diagram of the upstream positions of the motifs, colored red and green for motifs #1, and 2, respectively. Intensity of the color is proportional to the significance of the occurence of that motif at a given location. Motifs on the forward and reverse strand are represented over and under the line respectively.Functions:
Biological networks contain sets of regulatory units called functional modules that together play a role in regulation of specific functional processes. Connections between different modules in the network can help identify regulatory relationships such as hierarchy and epistasis. In addition, associating functions with modules enables putative assignment of functions to hypothetical genes. It is therefore essential to identify functional enrichment of modules within the regulatory network. We use hypergeometric p-values to identify significant overlaps between co-regulated module members and genes assigned to a particular Gene Ontology category. P-values are corrected for multiple comparisons by using Benjamini-Hochberg correction and filtered for p-values ≤ 0.05.UniProt Table
UniProt page will display table of Mycobacterium tuberculosis H37Rv UniProt entries. These entries are collected from UniProt proteome:up000001584 . Title is linked to individual entry pages that include more detailed information.
Table Columns
- Title: Entry ID linked to detailed gene page
- Entry Name: Entry Name.
- Tuberculist ID: Tuberculist specific ID linked to gene page at MTB Network Portal
- ORF Names: Entry ORF names
- Protein Names: Entry protein product name
- Pubmed IDs: Publications refererring to given entry. Clickin on the zoom icon will display Pubmed record in an overlay window.
- Symbol: Gene Symbol
- Synonyms: Alternative names
- Ensembl Bacteria: Link to http://ensemblgenomes.org/
Functions Table
Functions page will display functional annotations for Mycobacterium tuberculosis H37Rv from different resources. Currently, functional annotations from GO, KEGG, UniPathways and InterPro are included. Each function is linked to gene entries listed under this function.
GO Terms
Gene Ontology terms associated with MTB are listed. GO Terms are collected from http://geneontology.org/- GO Category: Higher level category for given term
- Name: Term ID/Name.
- Term Description: Description of the term
- Griffin Essential: Essentiality score of in vitro growth.
KEGG Functions
KEGG Pathway associations for MTB are listed. All MTB associated KEGG Pathways can be accessed at KEGG MTB Pathway Map- Title: KEGG Specific Term ID
- Term Description: Description
- Term Summary: Summary of total number of items assigned to this term linked to list of genes
UniPathway Functions
Unipathway is a manually curated resource of enzyme-catalyzed and spontaneous chemical reactions. All MTB associated Unipathway functions are listed in the table.- UniPathway Functions: Pathway description linked to list of entries assigned to given pathway
InterPro Terms
InterPro provides functional analysis of proteins by classifying them into families and predicting domains and important sites.- Term ID: InterPro specific Term ID linked to member of this term
- Description: Short description of term