motif_0054_1
Submitted by Anonymous (not verified) on Wed, 05/20/2015 - 14:16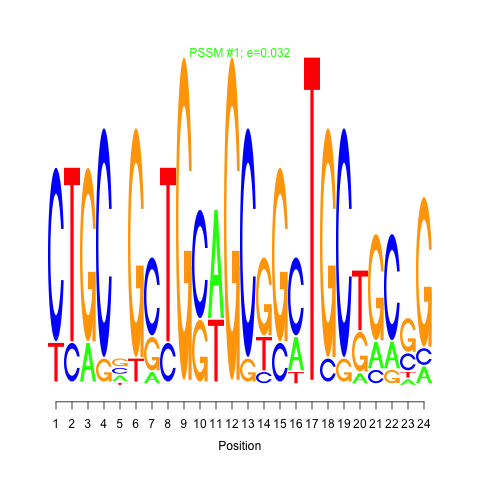
e.value:
0.032
Motif Bicluster:
Width:
24
Number of Sites:
1
Consensus:
CTGCnGcTGcaGCgGcTGCtGCgG
| Title | Model version | Residual | Score |
|---|---|---|---|
| bicluster_0054 | v02 | 0.10 | -19.21 |
|
Differential Expression Time:
8 hour  |
| Cre02.g144500.t1.1 KH domain-containing protein | Cre03.g185550.t1.2 sedoheptulose-bisphosphatase |
| Cre03.g189800.t1.2 cyclophilin 38 | Cre05.g234550.t2.1 fructose-bisphosphate aldolase 2 |
| Cre07.g315150.t1.2 Rubredoxin-like superfamily protein | Cre09.g389689.t1.1 semialdehyde dehydrogenase family protein |
| Cre10.g436550.t1.2 Low-CO2-inducible protein | Cre10.g440050.t1.2 chloroplast stem-loop binding protein of 41 kDa |
| Cre11.g467569.t1.1 ATP synthase delta-subunit gene | Cre11.g481450.t1.2 ATPase, F0 complex, subunit B/B\', bacterial/chloroplast |
| Cre12.g546150.t1.2 Cytochrome b6f complex PetM subunit | Cre12.g557600.t1.1 adenylate kinase 1 |
| Cre14.g623000.t1.1 Haloacid dehalogenase-like hydrolase (HAD) superfamily protein | Cre16.g650800.t1.1 translocase of the inner mitochondrial membrane 13 |
| Cre16.g663600.t1.2 phosphate transporter 4;5 | Cre17.g700425.t1.2 |
motif_0054_1Submitted by Anonymous (not verified) on Wed, 05/20/2015 - 14:16e.value: 0.032 Motif Bicluster: Width: 24 Number of Sites: 1 Consensus: CTGCnGcTGcaGCgGcTGCtGCgG |
motif_0054_2Submitted by Anonymous (not verified) on Wed, 05/20/2015 - 14:16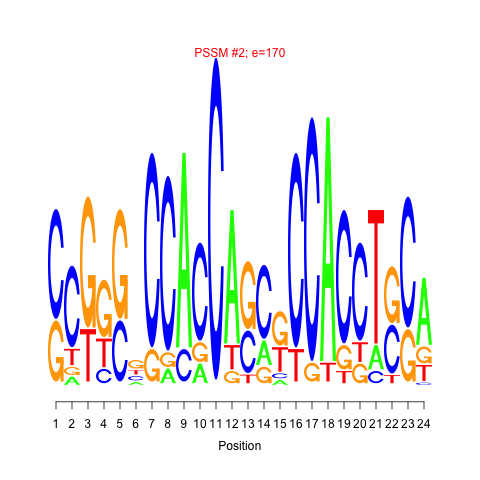 e.value: 170 Motif Bicluster: Width: 24 Number of Sites: 1 Consensus: cCGgggCCACCAgcgCCACCTgCa |
| Interaction | Weight | |
|---|---|---|
| down-regulates |
Cre12.g523000.t1.1Submitted by admin on Tue, 05/19/2015 - 15:51zinc finger protein 1 |
0.055222 |
| down-regulates |
Cre08.g375400.t1.1Submitted by admin on Tue, 05/19/2015 - 15:51KNOTTED-like homeobox of Arabidopsis thaliana 7 |
0.05474 |
| GO Terms | Descriptions |
|---|---|
| Not available |
Comments