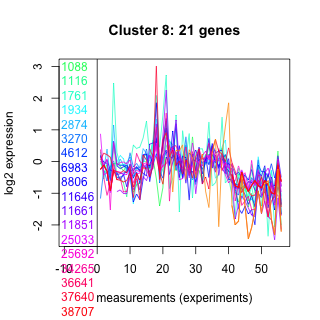
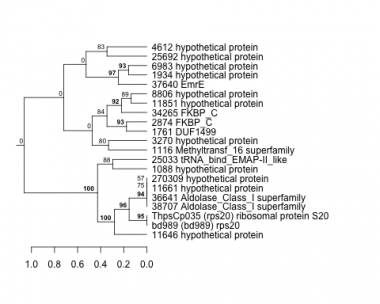
Thaps_hclust_0008 Hierarchical Clustering
Thalassiosira pseudonana
| GO ID | Go Term | p-value | q-value | Cluster |
|---|---|---|---|---|
| GO:0005975 | carbohydrate metabolism | 0.00341804 | 1 | Thaps_hclust_0008 |
| GO:0008152 | metabolic process | 0.00865617 | 1 | Thaps_hclust_0008 |
| GO:0006457 | protein folding | 0.0100167 | 1 | Thaps_hclust_0008 |
| GO:0006508 | proteolysis | 0.0172498 | 1 | Thaps_hclust_0008 |
|
1088 : hypothetical protein |
4612 : hypothetical protein |
11851 : hypothetical protein |
37640 : EmrE |
|
1116 : Methyltransf_16 superfamily |
6983 : hypothetical protein |
25033 : tRNA_bind_EMAP-II_like |
38707 : Aldolase_Class_I superfamily |
|
1761 : DUF1499 |
8806 : hypothetical protein |
25692 : hypothetical protein |
270309 : hypothetical protein |
|
1934 : hypothetical protein |
11646 : hypothetical protein |
34265 : FKBP_C |
bd989 : (bd989) rps20 |
|
2874 : FKBP_C |
11661 : hypothetical protein |
36641 : Aldolase_Class_I superfamily |
ThpsCp035 : (rps20) ribosomal protein S20 |
|
3270 : hypothetical protein |
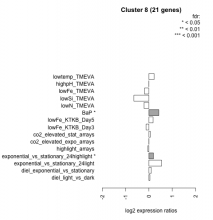
| Condition | Condition | Difference | FDR |
|---|---|---|---|
| diel_light_vs_dark | diel_light_vs_dark | 0.045 | 0.885 |
| lowFe_KTKB_Day3 | lowFe_KTKB_Day3 | -0.121 | 0.649 |
| lowFe_KTKB_Day5 | lowFe_KTKB_Day5 | 0.180 | 0.378 |
| BaP | BaP | 0.425 | 0.0353 |
| exponential_vs_stationary_24highlight | exponential_vs_stationary_24highlight | 0.197 | 0.0478 |
| co2_elevated_stat_arrays | co2_elevated_stat_arrays | 0.062 | 0.831 |
| lowtemp_TMEVA | lowtemp_TMEVA | 0.224 | 0.385 |
| highpH_TMEVA | highpH_TMEVA | -0.001 | 1 |
| co2_elevated_expo_arrays | co2_elevated_expo_arrays | 0.002 | 1 |
| lowFe_TMEVA | lowFe_TMEVA | -0.191 | 0.508 |
| exponential_vs_stationary_24light | exponential_vs_stationary_24light | 0.547 | 0.0718 |
| lowN_TMEVA | lowN_TMEVA | -0.209 | 0.566 |
| diel_exponential_vs_stationary | diel_exponential_vs_stationary | 0.099 | 0.63 |
| lowSi_TMEVA | lowSi_TMEVA | -0.644 | 0.0985 |
| highlight_arrays | highlight_arrays | -0.049 | 0.792 |


