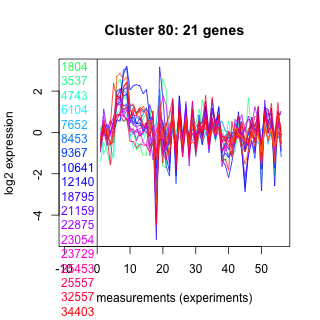
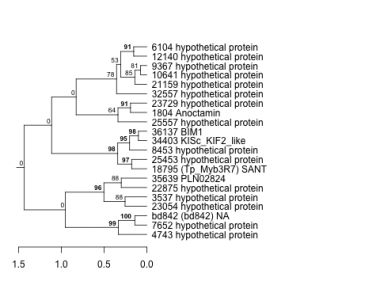
Thaps_hclust_0080 Hierarchical Clustering
Thalassiosira pseudonana
| GO ID | Go Term | p-value | q-value | Cluster |
|---|---|---|---|---|
| GO:0006725 | aromatic compound metabolism | 0.0180749 | 1 | Thaps_hclust_0080 |
| GO:0007018 | microtubule-based movement | 0.0350986 | 1 | Thaps_hclust_0080 |
| GO:0000074 | regulation of cell cycle | 0.0487168 | 1 | Thaps_hclust_0080 |
| GO:0016567 | protein ubiquitination | 0.0637659 | 1 | Thaps_hclust_0080 |
|
1804 : Anoctamin |
9367 : hypothetical protein |
22875 : hypothetical protein |
32557 : hypothetical protein |
|
3537 : hypothetical protein |
10641 : hypothetical protein |
23054 : hypothetical protein |
34403 : KISc_KIF2_like |
|
4743 : hypothetical protein |
12140 : hypothetical protein |
23729 : hypothetical protein |
35639 : PLN02824 |
|
6104 : hypothetical protein |
18795 : (Tp_Myb3R7) SANT |
25453 : hypothetical protein |
36137 : BIM1 |
|
7652 : hypothetical protein |
21159 : hypothetical protein |
25557 : hypothetical protein |
bd842 : (bd842) NA |
|
8453 : hypothetical protein |
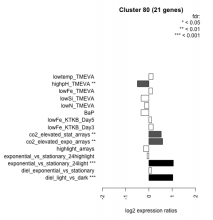
| Condition | Condition | Difference | FDR |
|---|---|---|---|
| diel_light_vs_dark | diel_light_vs_dark | 1.030 | 0.000485 |
| lowFe_KTKB_Day3 | lowFe_KTKB_Day3 | 0.184 | 0.463 |
| lowFe_KTKB_Day5 | lowFe_KTKB_Day5 | 0.115 | 0.586 |
| BaP | BaP | -0.336 | 0.0935 |
| exponential_vs_stationary_24highlight | exponential_vs_stationary_24highlight | -0.077 | 0.484 |
| co2_elevated_stat_arrays | co2_elevated_stat_arrays | 0.528 | 0.00446 |
| lowtemp_TMEVA | lowtemp_TMEVA | 0.180 | 0.479 |
| highpH_TMEVA | highpH_TMEVA | -0.496 | 0.00137 |
| co2_elevated_expo_arrays | co2_elevated_expo_arrays | 0.588 | 0.00139 |
| lowFe_TMEVA | lowFe_TMEVA | 0.153 | 0.63 |
| exponential_vs_stationary_24light | exponential_vs_stationary_24light | 1.050 | 0.000581 |
| lowN_TMEVA | lowN_TMEVA | -0.187 | 0.614 |
| diel_exponential_vs_stationary | diel_exponential_vs_stationary | 0.107 | 0.596 |
| lowSi_TMEVA | lowSi_TMEVA | -0.333 | 0.614 |
| highlight_arrays | highlight_arrays | -0.227 | 0.142 |


