Thaps_hclust_0368 Hierarchical Clustering
Thalassiosira pseudonana
| Cluster Plot | Conditions Plot | Dendrogram |
|---|---|---|
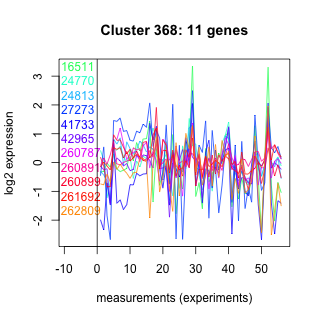 |
 |
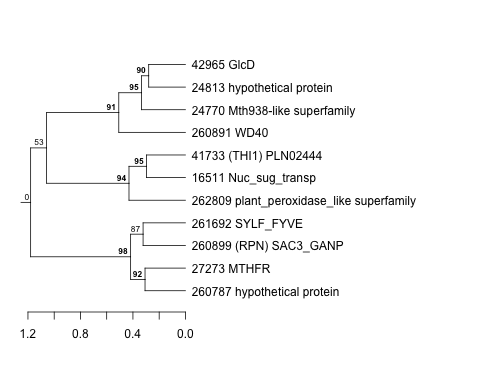 |
| GO ID | Go Term | p-value | q-value | Cluster |
|---|---|---|---|---|
| GO:0006555 | methionine metabolism | 0.00289256 | 1 | Thaps_hclust_0368 |
| GO:0008380 | RNA splicing | 0.00289256 | 1 | Thaps_hclust_0368 |
| GO:0009228 | thiamin biosynthesis | 0.00577795 | 1 | Thaps_hclust_0368 |
| GO:0008643 | carbohydrate transport | 0.0200978 | 1 | Thaps_hclust_0368 |
| GO:0006979 | response to oxidative stress | 0.0342405 | 1 | Thaps_hclust_0368 |
| GO:0006118 | electron transport | 0.327122 | 1 | Thaps_hclust_0368 |
| GO:0006508 | proteolysis and peptidolysis | 0.349482 | 1 | Thaps_hclust_0368 |
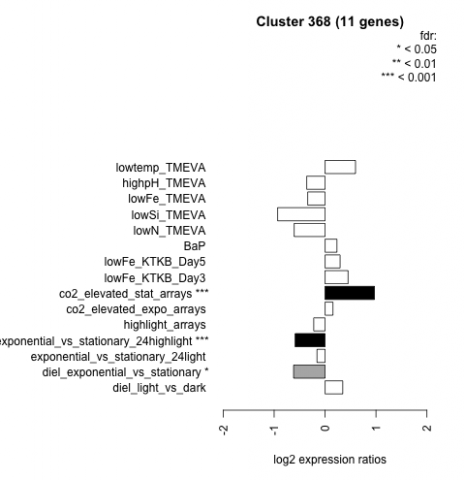
| Condition | Condition | Difference | FDR |
|---|---|---|---|
| diel_light_vs_dark | diel_light_vs_dark | 0.347 | 0.224 |
| lowFe_KTKB_Day3 | lowFe_KTKB_Day3 | 0.453 | 0.149 |
| lowFe_KTKB_Day5 | lowFe_KTKB_Day5 | 0.295 | 0.274 |
| BaP | BaP | 0.233 | 0.449 |
| exponential_vs_stationary_24highlight | exponential_vs_stationary_24highlight | -0.588 | 0.000526 |
| co2_elevated_stat_arrays | co2_elevated_stat_arrays | 0.971 | 0.000658 |
| lowtemp_TMEVA | lowtemp_TMEVA | 0.598 | 0.0829 |
| highpH_TMEVA | highpH_TMEVA | -0.361 | 0.0799 |
| co2_elevated_expo_arrays | co2_elevated_expo_arrays | 0.154 | 0.545 |
| lowFe_TMEVA | lowFe_TMEVA | -0.341 | 0.316 |
| exponential_vs_stationary_24light | exponential_vs_stationary_24light | -0.158 | 0.75 |
| lowN_TMEVA | lowN_TMEVA | -0.607 | 0.139 |
| diel_exponential_vs_stationary | diel_exponential_vs_stationary | -0.617 | 0.0126 |
| lowSi_TMEVA | lowSi_TMEVA | -0.932 | 0.0655 |
| highlight_arrays | highlight_arrays | -0.223 | 0.303 |