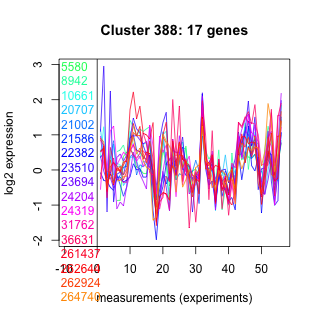
Thaps_hclust_0388 Hierarchical Clustering
Thalassiosira pseudonana
| Cluster Plot | Conditions Plot | Dendrogram |
|---|---|---|
 |
 |
 |
| GO ID | Go Term | p-value | q-value | Cluster |
|---|---|---|---|---|
| GO:0006032 | chitin catabolism | 0.00824568 | 1 | Thaps_hclust_0388 |
| GO:0016998 | cell wall catabolism | 0.00927255 | 1 | Thaps_hclust_0388 |
| GO:0009613 | response to pest, pathogen or parasite | 0.00927255 | 1 | Thaps_hclust_0388 |
| GO:0006030 | chitin metabolism | 0.0215288 | 1 | Thaps_hclust_0388 |
| GO:0008152 | metabolism | 0.355748 | 1 | Thaps_hclust_0388 |
|
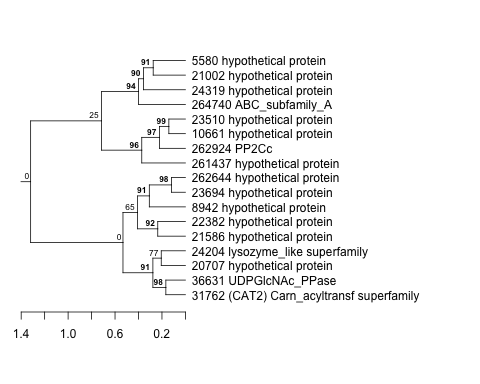
5580 : hypothetical protein |
21586 : hypothetical protein |
24204 : lysozyme_like superfamily |
261437 : hypothetical protein |
|
8942 : hypothetical protein |
22382 : hypothetical protein |
24319 : hypothetical protein |
262644 : hypothetical protein |
|
10661 : hypothetical protein |
23510 : hypothetical protein |
31762 : (CAT2) Carn_acyltransf superfamily |
262924 : PP2Cc |
|
20707 : hypothetical protein |
23694 : hypothetical protein |
36631 : UDPGlcNAc_PPase |
264740 : ABC_subfamily_A |
|
21002 : hypothetical protein |
| Condition | Condition | Difference | FDR |
|---|---|---|---|
| diel_light_vs_dark | diel_light_vs_dark | 0.181 | 0.477 |
| lowFe_KTKB_Day3 | lowFe_KTKB_Day3 | 0.550 | 0.0258 |
| lowFe_KTKB_Day5 | lowFe_KTKB_Day5 | -0.173 | 0.451 |
| BaP | BaP | -0.186 | 0.455 |
| exponential_vs_stationary_24highlight | exponential_vs_stationary_24highlight | -0.007 | 0.967 |
| co2_elevated_stat_arrays | co2_elevated_stat_arrays | 0.952 | 0.000658 |
| lowtemp_TMEVA | lowtemp_TMEVA | 0.037 | 0.923 |
| highpH_TMEVA | highpH_TMEVA | 0.487 | 0.0081 |
| co2_elevated_expo_arrays | co2_elevated_expo_arrays | 0.004 | 0.997 |
| lowFe_TMEVA | lowFe_TMEVA | 0.691 | 0.00847 |
| exponential_vs_stationary_24light | exponential_vs_stationary_24light | -0.023 | 0.961 |
| lowN_TMEVA | lowN_TMEVA | -0.400 | 0.261 |
| diel_exponential_vs_stationary | diel_exponential_vs_stationary | 0.475 | 0.0126 |
| lowSi_TMEVA | lowSi_TMEVA | 0.291 | 0.723 |
| highlight_arrays | highlight_arrays | 0.241 | 0.157 |