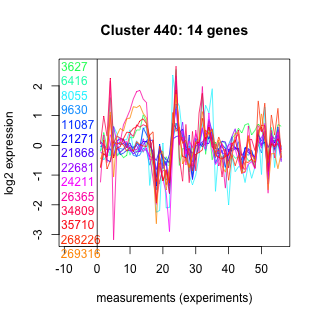
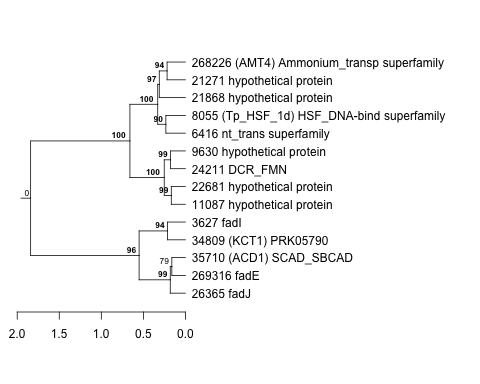
Thaps_hclust_0440 Hierarchical Clustering
Thalassiosira pseudonana
| Cluster Plot | Conditions Plot | Dendrogram |
|---|---|---|
 |
 |
 |
| GO ID | Go Term | p-value | q-value | Cluster |
|---|---|---|---|---|
| GO:0006631 | fatty acid metabolism | 0.00433615 | 1 | Thaps_hclust_0440 |
| GO:0006118 | electron transport | 0.00487828 | 1 | Thaps_hclust_0440 |
| GO:0006810 | transport | 0.237879 | 1 | Thaps_hclust_0440 |
| GO:0006355 | regulation of transcription, DNA-dependent | 0.368277 | 1 | Thaps_hclust_0440 |
| GO:0008152 | metabolism | 0.459719 | 1 | Thaps_hclust_0440 |
|
3627 : fadI |
11087 : hypothetical protein |
24211 : DCR_FMN |
35710 : (ACD1) SCAD_SBCAD |
|
6416 : nt_trans superfamily |
21271 : hypothetical protein |
26365 : fadJ |
268226 : (AMT4) Ammonium_transp superfamily |
|
8055 : (Tp_HSF_1d) HSF_DNA-bind superfamily |
21868 : hypothetical protein |
34809 : (KCT1) PRK05790 |
269316 : fadE |
|
9630 : hypothetical protein |
22681 : hypothetical protein |
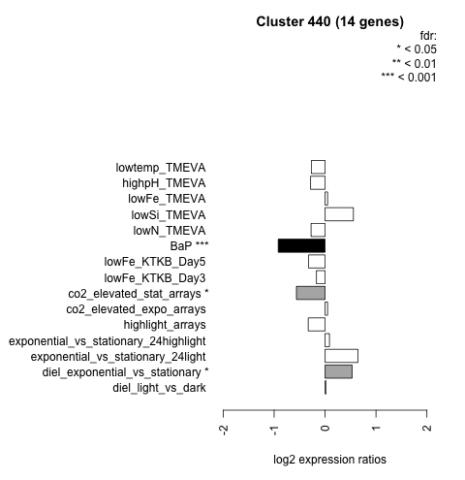
| Condition | Condition | Difference | FDR |
|---|---|---|---|
| diel_light_vs_dark | diel_light_vs_dark | 0.020 | 0.959 |
| lowFe_KTKB_Day3 | lowFe_KTKB_Day3 | -0.170 | 0.595 |
| lowFe_KTKB_Day5 | lowFe_KTKB_Day5 | -0.325 | 0.188 |
| BaP | BaP | -0.920 | 0.00037 |
| exponential_vs_stationary_24highlight | exponential_vs_stationary_24highlight | 0.087 | 0.533 |
| co2_elevated_stat_arrays | co2_elevated_stat_arrays | -0.562 | 0.0227 |
| lowtemp_TMEVA | lowtemp_TMEVA | -0.269 | 0.377 |
| highpH_TMEVA | highpH_TMEVA | -0.285 | 0.116 |
| co2_elevated_expo_arrays | co2_elevated_expo_arrays | 0.050 | 0.922 |
| lowFe_TMEVA | lowFe_TMEVA | 0.051 | 0.908 |
| exponential_vs_stationary_24light | exponential_vs_stationary_24light | 0.646 | 0.0741 |
| lowN_TMEVA | lowN_TMEVA | -0.274 | 0.489 |
| diel_exponential_vs_stationary | diel_exponential_vs_stationary | 0.531 | 0.0108 |
| lowSi_TMEVA | lowSi_TMEVA | 0.556 | 0.317 |
| highlight_arrays | highlight_arrays | -0.330 | 0.0755 |