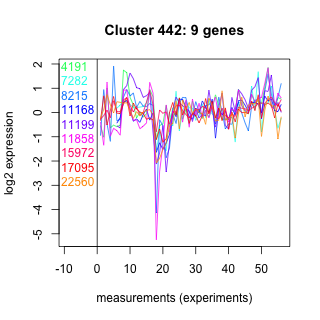
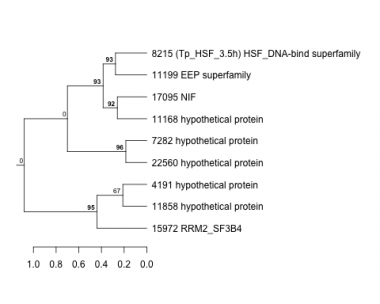
Thaps_hclust_0442 Hierarchical Clustering
Thalassiosira pseudonana
| GO ID | Go Term | p-value | q-value | Cluster |
|---|---|---|---|---|
| GO:0006355 | regulation of transcription, DNA-dependent | 0.0115414 | 1 | Thaps_hclust_0442 |
| GO:0007186 | G-protein coupled receptor protein signaling pathway | 0.0129708 | 1 | Thaps_hclust_0442 |
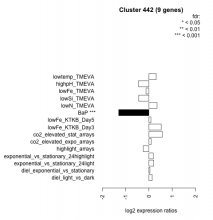
| Condition | Condition | Difference | FDR |
|---|---|---|---|
| BaP | BaP | -1.300 | 0.00037 |
| co2_elevated_stat_arrays | co2_elevated_stat_arrays | 0.573 | 0.0513 |
| highpH_TMEVA | highpH_TMEVA | -0.453 | 0.0524 |
| lowFe_KTKB_Day3 | lowFe_KTKB_Day3 | 0.528 | 0.14 |
| exponential_vs_stationary_24highlight | exponential_vs_stationary_24highlight | 0.187 | 0.24 |
| highlight_arrays | highlight_arrays | -0.241 | 0.311 |
| lowtemp_TMEVA | lowtemp_TMEVA | 0.311 | 0.388 |
| lowN_TMEVA | lowN_TMEVA | 0.349 | 0.436 |
| lowSi_TMEVA | lowSi_TMEVA | -0.435 | 0.557 |
| exponential_vs_stationary_24light | exponential_vs_stationary_24light | 0.209 | 0.684 |
| diel_light_vs_dark | diel_light_vs_dark | 0.140 | 0.716 |
| lowFe_KTKB_Day5 | lowFe_KTKB_Day5 | 0.088 | 0.787 |
| lowFe_TMEVA | lowFe_TMEVA | -0.122 | 0.795 |
| co2_elevated_expo_arrays | co2_elevated_expo_arrays | 0.099 | 0.802 |
| diel_exponential_vs_stationary | diel_exponential_vs_stationary | 0.045 | 0.896 |


