Hierarchical Clusters
Displaying 1601 - 1700 of 7500
| Title | Cluster Plot | Dendrogram | e-value | e-value | e-value | Condition | Condition FDR | Condition Difference |
|---|---|---|---|---|---|---|---|---|
| Thaps_hclust_0394 |
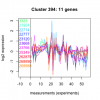 |
 |
0.044 |
0.46 |
610 |
lowFe_KTKB_Day3 | 0.068600 | 0.575 |
| Thaps_hclust_0394 |
 |
 |
0.044 |
0.46 |
610 |
lowFe_KTKB_Day5 | 0.849000 | 0.0572 |
| Thaps_hclust_0394 |
 |
 |
0.044 |
0.46 |
610 |
BaP | 0.437000 | 0.237 |
| Thaps_hclust_0394 |
 |
 |
0.044 |
0.46 |
610 |
exponential_vs_stationary_24highlight | 0.310000 | 0.15 |
| Thaps_hclust_0394 |
 |
 |
0.044 |
0.46 |
610 |
co2_elevated_stat_arrays | 0.477000 | -0.203 |
| Title | Cluster Plot | Dendrogram | e-value | e-value | e-value | Condition | Condition FDR | Condition Difference |
|---|---|---|---|---|---|---|---|---|
| Thaps_hclust_0393 |
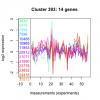 |
 |
2 |
16 |
16 |
co2_elevated_stat_arrays | 0.209000 | 0.319 |
| Thaps_hclust_0393 |
 |
 |
2 |
16 |
16 |
lowtemp_TMEVA | 0.825000 | -0.0751 |
| Thaps_hclust_0393 |
 |
 |
2 |
16 |
16 |
highpH_TMEVA | 0.664000 | 0.0938 |
| Thaps_hclust_0393 |
 |
 |
2 |
16 |
16 |
co2_elevated_expo_arrays | 0.911000 | -0.054 |
| Thaps_hclust_0393 |
 |
 |
2 |
16 |
16 |
lowFe_TMEVA | 0.776000 | 0.119 |
| Thaps_hclust_0393 |
 |
 |
2 |
16 |
16 |
exponential_vs_stationary_24light | 0.346000 | -0.354 |
| Thaps_hclust_0393 |
 |
 |
2 |
16 |
16 |
lowN_TMEVA | 0.608000 | -0.208 |
| Thaps_hclust_0393 |
 |
 |
2 |
16 |
16 |
diel_exponential_vs_stationary | 0.597000 | -0.127 |
| Thaps_hclust_0393 |
 |
 |
2 |
16 |
16 |
lowSi_TMEVA | 0.844000 | -0.218 |
| Thaps_hclust_0393 |
 |
 |
2 |
16 |
16 |
highlight_arrays | 0.027300 | 0.404 |
| Thaps_hclust_0393 |
 |
 |
2 |
16 |
16 |
diel_light_vs_dark | 0.019500 | 0.549 |
| Thaps_hclust_0393 |
 |
 |
2 |
16 |
16 |
lowFe_KTKB_Day3 | 0.118000 | 0.435 |
| Thaps_hclust_0393 |
 |
 |
2 |
16 |
16 |
lowFe_KTKB_Day5 | 0.767000 | -0.0803 |
| Thaps_hclust_0393 |
 |
 |
2 |
16 |
16 |
BaP | 0.099300 | 0.414 |
| Thaps_hclust_0393 |
 |
 |
2 |
16 |
16 |
exponential_vs_stationary_24highlight | 0.374000 | -0.119 |
| Title | Cluster Plot | Dendrogram | e-value | e-value | e-value | Condition | Condition FDR | Condition Difference |
|---|---|---|---|---|---|---|---|---|
| Thaps_hclust_0392 |
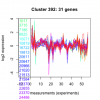 |
 |
0.00055 |
0.0027 |
0.19 |
exponential_vs_stationary_24highlight | 0.000526 | -0.39 |
| Thaps_hclust_0392 |
 |
 |
0.00055 |
0.0027 |
0.19 |
co2_elevated_stat_arrays | 0.066800 | 0.335 |
| Thaps_hclust_0392 |
 |
 |
0.00055 |
0.0027 |
0.19 |
lowtemp_TMEVA | 0.047700 | -0.393 |
| Thaps_hclust_0392 |
 |
 |
0.00055 |
0.0027 |
0.19 |
highpH_TMEVA | 0.000725 | 0.886 |
| Thaps_hclust_0392 |
 |
 |
0.00055 |
0.0027 |
0.19 |
co2_elevated_expo_arrays | 0.677000 | 0.0977 |
| Thaps_hclust_0392 |
 |
 |
0.00055 |
0.0027 |
0.19 |
lowFe_TMEVA | 0.001040 | 0.737 |
| Thaps_hclust_0392 |
 |
 |
0.00055 |
0.0027 |
0.19 |
exponential_vs_stationary_24light | 0.003570 | -0.677 |
| Thaps_hclust_0392 |
 |
 |
0.00055 |
0.0027 |
0.19 |
lowN_TMEVA | 0.621000 | -0.17 |
| Thaps_hclust_0392 |
 |
 |
0.00055 |
0.0027 |
0.19 |
diel_exponential_vs_stationary | 0.415000 | -0.129 |
| Thaps_hclust_0392 |
 |
 |
0.00055 |
0.0027 |
0.19 |
lowSi_TMEVA | 0.010400 | 0.778 |
| Thaps_hclust_0392 |
 |
 |
0.00055 |
0.0027 |
0.19 |
highlight_arrays | 0.000442 | 0.467 |
| Thaps_hclust_0392 |
 |
 |
0.00055 |
0.0027 |
0.19 |
diel_light_vs_dark | 0.952000 | 0.0185 |
| Thaps_hclust_0392 |
 |
 |
0.00055 |
0.0027 |
0.19 |
lowFe_KTKB_Day3 | 0.604000 | 0.109 |
| Thaps_hclust_0392 |
 |
 |
0.00055 |
0.0027 |
0.19 |
lowFe_KTKB_Day5 | 0.656000 | 0.0795 |
| Thaps_hclust_0392 |
 |
 |
0.00055 |
0.0027 |
0.19 |
BaP | 0.257000 | -0.2 |
| Title | Cluster Plot | Dendrogram | e-value | e-value | e-value | Condition | Condition FDR | Condition Difference |
|---|---|---|---|---|---|---|---|---|
| Thaps_hclust_0391 |
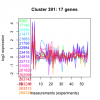 |
 |
1.9 |
34 |
32 |
BaP | 0.227000 | 0.292 |
| Thaps_hclust_0391 |
 |
 |
1.9 |
34 |
32 |
exponential_vs_stationary_24highlight | 0.005770 | -0.321 |
| Thaps_hclust_0391 |
 |
 |
1.9 |
34 |
32 |
co2_elevated_stat_arrays | 0.953000 | -0.0141 |
| Thaps_hclust_0391 |
 |
 |
1.9 |
34 |
32 |
lowtemp_TMEVA | 0.263000 | -0.314 |
| Thaps_hclust_0391 |
 |
 |
1.9 |
34 |
32 |
highpH_TMEVA | 0.124000 | 0.262 |
| Thaps_hclust_0391 |
 |
 |
1.9 |
34 |
32 |
co2_elevated_expo_arrays | 0.563000 | 0.132 |
| Thaps_hclust_0391 |
 |
 |
1.9 |
34 |
32 |
lowFe_TMEVA | 0.001040 | 2.32 |
| Thaps_hclust_0391 |
 |
 |
1.9 |
34 |
32 |
exponential_vs_stationary_24light | 0.230000 | -0.406 |
| Thaps_hclust_0391 |
 |
 |
1.9 |
34 |
32 |
lowN_TMEVA | 0.113000 | -0.546 |
| Thaps_hclust_0391 |
 |
 |
1.9 |
34 |
32 |
diel_exponential_vs_stationary | 0.797000 | -0.0601 |
| Thaps_hclust_0391 |
 |
 |
1.9 |
34 |
32 |
lowSi_TMEVA | 0.001350 | 2.41 |
| Thaps_hclust_0391 |
 |
 |
1.9 |
34 |
32 |
highlight_arrays | 0.650000 | 0.0883 |
| Thaps_hclust_0391 |
 |
 |
1.9 |
34 |
32 |
diel_light_vs_dark | 0.018500 | 0.494 |
| Thaps_hclust_0391 |
 |
 |
1.9 |
34 |
32 |
lowFe_KTKB_Day3 | 0.375000 | 0.24 |
| Thaps_hclust_0391 |
 |
 |
1.9 |
34 |
32 |
lowFe_KTKB_Day5 | 0.475000 | 0.166 |
| Title | Cluster Plot | Dendrogram | e-value | e-value | e-value | Condition | Condition FDR | Condition Difference |
|---|---|---|---|---|---|---|---|---|
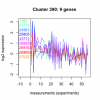
| Thaps_hclust_0390 |
 |
 |
0.013 |
0.066 |
0.15 |
lowFe_KTKB_Day5 | 0.559000 | 0.184 |
| Thaps_hclust_0390 |
 |
 |
0.013 |
0.066 |
0.15 |
BaP | 0.104000 | 0.511 |
| Thaps_hclust_0390 |
 |
 |
0.013 |
0.066 |
0.15 |
exponential_vs_stationary_24highlight | 0.678000 | -0.0705 |
| Thaps_hclust_0390 |
 |
 |
0.013 |
0.066 |
0.15 |
co2_elevated_stat_arrays | 0.993000 | -0.00341 |
| Thaps_hclust_0390 |
 |
 |
0.013 |
0.066 |
0.15 |
lowtemp_TMEVA | 0.250000 | 0.428 |
| Thaps_hclust_0390 |
 |
 |
0.013 |
0.066 |
0.15 |
highpH_TMEVA | 0.993000 | -0.00576 |
| Thaps_hclust_0390 |
 |
 |
0.013 |
0.066 |
0.15 |
co2_elevated_expo_arrays | 0.211000 | 0.275 |
| Thaps_hclust_0390 |
 |
 |
0.013 |
0.066 |
0.15 |
lowFe_TMEVA | 0.001040 | 2.14 |
| Thaps_hclust_0390 |
 |
 |
0.013 |
0.066 |
0.15 |
exponential_vs_stationary_24light | 0.271000 | 0.488 |
| Thaps_hclust_0390 |
 |
 |
0.013 |
0.066 |
0.15 |
lowN_TMEVA | 0.033300 | -1 |
| Thaps_hclust_0390 |
 |
 |
0.013 |
0.066 |
0.15 |
diel_exponential_vs_stationary | 0.222000 | 0.328 |
| Thaps_hclust_0390 |
 |
 |
0.013 |
0.066 |
0.15 |
lowSi_TMEVA | 0.004350 | 1.45 |
| Thaps_hclust_0390 |
 |
 |
0.013 |
0.066 |
0.15 |
highlight_arrays | 0.592000 | -0.13 |
| Thaps_hclust_0390 |
 |
 |
0.013 |
0.066 |
0.15 |
diel_light_vs_dark | 0.016000 | 0.728 |
| Thaps_hclust_0390 |
 |
 |
0.013 |
0.066 |
0.15 |
lowFe_KTKB_Day3 | 0.446000 | 0.286 |
| Title | Cluster Plot | Dendrogram | e-value | e-value | e-value | Condition | Condition FDR | Condition Difference |
|---|---|---|---|---|---|---|---|---|
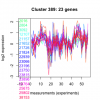
| Thaps_hclust_0389 |
 |
 |
0.00000008 |
0.00077 |
340 |
lowFe_KTKB_Day5 | 0.162000 | -0.258 |
| Thaps_hclust_0389 |
 |
 |
0.00000008 |
0.00077 |
340 |
BaP | 0.005340 | -0.534 |
| Thaps_hclust_0389 |
 |
 |
0.00000008 |
0.00077 |
340 |
exponential_vs_stationary_24highlight | 0.400000 | 0.0872 |
| Thaps_hclust_0389 |
 |
 |
0.00000008 |
0.00077 |
340 |
co2_elevated_stat_arrays | 0.090200 | 0.349 |
| Thaps_hclust_0389 |
 |
 |
0.00000008 |
0.00077 |
340 |
lowtemp_TMEVA | 0.413000 | -0.199 |
| Thaps_hclust_0389 |
 |
 |
0.00000008 |
0.00077 |
340 |
highpH_TMEVA | 0.984000 | -0.00695 |
| Thaps_hclust_0389 |
 |
 |
0.00000008 |
0.00077 |
340 |
co2_elevated_expo_arrays | 0.830000 | -0.0739 |
| Thaps_hclust_0389 |
 |
 |
0.00000008 |
0.00077 |
340 |
lowFe_TMEVA | 0.911000 | 0.0434 |
| Thaps_hclust_0389 |
 |
 |
0.00000008 |
0.00077 |
340 |
exponential_vs_stationary_24light | 0.576000 | 0.19 |
| Thaps_hclust_0389 |
 |
 |
0.00000008 |
0.00077 |
340 |
lowN_TMEVA | 0.893000 | -0.0455 |
| Thaps_hclust_0389 |
 |
 |
0.00000008 |
0.00077 |
340 |
diel_exponential_vs_stationary | 0.052300 | 0.3 |
| Thaps_hclust_0389 |
 |
 |
0.00000008 |
0.00077 |
340 |
lowSi_TMEVA | 0.986000 | -0.107 |
| Thaps_hclust_0389 |
 |
 |
0.00000008 |
0.00077 |
340 |
highlight_arrays | 0.050500 | 0.285 |
| Thaps_hclust_0389 |
 |
 |
0.00000008 |
0.00077 |
340 |
diel_light_vs_dark | 0.314000 | 0.208 |
| Thaps_hclust_0389 |
 |
 |
0.00000008 |
0.00077 |
340 |
lowFe_KTKB_Day3 | 0.834000 | 0.0578 |
| Title | Cluster Plot | Dendrogram | e-value | e-value | e-value | Condition | Condition FDR | Condition Difference |
|---|---|---|---|---|---|---|---|---|
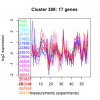
| Thaps_hclust_0388 |
 |
 |
0.0000000024 |
23 |
380 |
lowFe_KTKB_Day3 | 0.025800 | 0.55 |
| Thaps_hclust_0388 |
 |
 |
0.0000000024 |
23 |
380 |
lowFe_KTKB_Day5 | 0.451000 | -0.173 |
| Thaps_hclust_0388 |
 |
 |
0.0000000024 |
23 |
380 |
BaP | 0.455000 | -0.186 |
| Thaps_hclust_0388 |
 |
 |
0.0000000024 |
23 |
380 |
exponential_vs_stationary_24highlight | 0.967000 | -0.00706 |
| Thaps_hclust_0388 |
 |
 |
0.0000000024 |
23 |
380 |
co2_elevated_stat_arrays | 0.000658 | 0.952 |
| Thaps_hclust_0388 |
 |
 |
0.0000000024 |
23 |
380 |
lowtemp_TMEVA | 0.923000 | 0.0368 |
| Thaps_hclust_0388 |
 |
 |
0.0000000024 |
23 |
380 |
highpH_TMEVA | 0.008100 | 0.487 |
| Thaps_hclust_0388 |
 |
 |
0.0000000024 |
23 |
380 |
co2_elevated_expo_arrays | 0.997000 | 0.00442 |
| Thaps_hclust_0388 |
 |
 |
0.0000000024 |
23 |
380 |
lowFe_TMEVA | 0.008470 | 0.691 |
| Thaps_hclust_0388 |
 |
 |
0.0000000024 |
23 |
380 |
exponential_vs_stationary_24light | 0.961000 | -0.0225 |
| Thaps_hclust_0388 |
 |
 |
0.0000000024 |
23 |
380 |
lowN_TMEVA | 0.261000 | -0.4 |
| Thaps_hclust_0388 |
 |
 |
0.0000000024 |
23 |
380 |
diel_exponential_vs_stationary | 0.012600 | 0.475 |
| Thaps_hclust_0388 |
 |
 |
0.0000000024 |
23 |
380 |
lowSi_TMEVA | 0.723000 | 0.291 |
| Thaps_hclust_0388 |
 |
 |
0.0000000024 |
23 |
380 |
highlight_arrays | 0.157000 | 0.241 |
| Thaps_hclust_0388 |
 |
 |
0.0000000024 |
23 |
380 |
diel_light_vs_dark | 0.477000 | 0.181 |
| Title | Cluster Plot | Dendrogram | e-value | e-value | e-value | Condition | Condition FDR | Condition Difference |
|---|---|---|---|---|---|---|---|---|
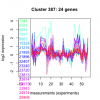
| Thaps_hclust_0387 |
 |
 |
0.0023 |
0.003 |
0.38 |
diel_light_vs_dark | 0.952000 | 0.0229 |
| Thaps_hclust_0387 |
 |
 |
0.0023 |
0.003 |
0.38 |
lowFe_KTKB_Day3 | 0.534000 | -0.15 |
| Thaps_hclust_0387 |
 |
 |
0.0023 |
0.003 |
0.38 |
lowFe_KTKB_Day5 | 0.239000 | -0.221 |
| Thaps_hclust_0387 |
 |
 |
0.0023 |
0.003 |
0.38 |
BaP | 0.017500 | 0.462 |
| Thaps_hclust_0387 |
 |
 |
0.0023 |
0.003 |
0.38 |
exponential_vs_stationary_24highlight | 0.002100 | -0.286 |
