Hierarchical Clusters
Displaying 1901 - 2000 of 7500
| Title | Cluster Plot | Dendrogram | e-value | e-value | e-value | Condition | Condition FDR | Condition Difference |
|---|---|---|---|---|---|---|---|---|
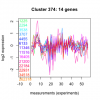
| Thaps_hclust_0374 |
 |
 |
1.4 |
19 |
50 |
lowFe_KTKB_Day3 | 0.458000 | -0.224 |
| Thaps_hclust_0374 |
 |
 |
1.4 |
19 |
50 |
lowFe_KTKB_Day5 | 0.425000 | 0.199 |
| Thaps_hclust_0374 |
 |
 |
1.4 |
19 |
50 |
BaP | 0.239000 | -0.308 |
| Thaps_hclust_0374 |
 |
 |
1.4 |
19 |
50 |
exponential_vs_stationary_24highlight | 0.948000 | 0.0126 |
| Thaps_hclust_0374 |
 |
 |
1.4 |
19 |
50 |
co2_elevated_stat_arrays | 0.463000 | -0.197 |
| Title | Cluster Plot | Dendrogram | e-value | e-value | e-value | Condition | Condition FDR | Condition Difference |
|---|---|---|---|---|---|---|---|---|
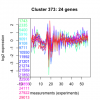
| Thaps_hclust_0373 |
 |
 |
0.00017 |
0.001 |
0.066 |
co2_elevated_stat_arrays | 0.886000 | -0.0432 |
| Thaps_hclust_0373 |
 |
 |
0.00017 |
0.001 |
0.066 |
lowtemp_TMEVA | 0.445000 | 0.182 |
| Thaps_hclust_0373 |
 |
 |
0.00017 |
0.001 |
0.066 |
highpH_TMEVA | 0.011100 | -0.373 |
| Thaps_hclust_0373 |
 |
 |
0.00017 |
0.001 |
0.066 |
co2_elevated_expo_arrays | 0.108000 | 0.218 |
| Thaps_hclust_0373 |
 |
 |
0.00017 |
0.001 |
0.066 |
lowFe_TMEVA | 0.630000 | 0.149 |
| Thaps_hclust_0373 |
 |
 |
0.00017 |
0.001 |
0.066 |
exponential_vs_stationary_24light | 0.138000 | 0.431 |
| Thaps_hclust_0373 |
 |
 |
0.00017 |
0.001 |
0.066 |
lowN_TMEVA | 0.293000 | -0.333 |
| Thaps_hclust_0373 |
 |
 |
0.00017 |
0.001 |
0.066 |
diel_exponential_vs_stationary | 0.564000 | -0.109 |
| Thaps_hclust_0373 |
 |
 |
0.00017 |
0.001 |
0.066 |
lowSi_TMEVA | 1.000000 | -0.0116 |
| Thaps_hclust_0373 |
 |
 |
0.00017 |
0.001 |
0.066 |
highlight_arrays | 0.026700 | -0.319 |
| Thaps_hclust_0373 |
 |
 |
0.00017 |
0.001 |
0.066 |
diel_light_vs_dark | 0.000485 | 0.631 |
| Thaps_hclust_0373 |
 |
 |
0.00017 |
0.001 |
0.066 |
lowFe_KTKB_Day3 | 0.109000 | 0.335 |
| Thaps_hclust_0373 |
 |
 |
0.00017 |
0.001 |
0.066 |
lowFe_KTKB_Day5 | 0.001320 | 0.536 |
| Thaps_hclust_0373 |
 |
 |
0.00017 |
0.001 |
0.066 |
BaP | 0.000370 | -0.916 |
| Thaps_hclust_0373 |
 |
 |
0.00017 |
0.001 |
0.066 |
exponential_vs_stationary_24highlight | 0.935000 | -0.0117 |
| Title | Cluster Plot | Dendrogram | e-value | e-value | e-value | Condition | Condition FDR | Condition Difference |
|---|---|---|---|---|---|---|---|---|
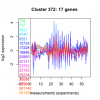
| Thaps_hclust_0372 |
 |
 |
0.0016 |
0.064 |
18 |
exponential_vs_stationary_24highlight | 0.676000 | -0.0545 |
| Thaps_hclust_0372 |
 |
 |
0.0016 |
0.064 |
18 |
co2_elevated_stat_arrays | 0.884000 | 0.0445 |
| Thaps_hclust_0372 |
 |
 |
0.0016 |
0.064 |
18 |
lowtemp_TMEVA | 0.206000 | 0.354 |
| Thaps_hclust_0372 |
 |
 |
0.0016 |
0.064 |
18 |
highpH_TMEVA | 0.867000 | -0.038 |
| Thaps_hclust_0372 |
 |
 |
0.0016 |
0.064 |
18 |
co2_elevated_expo_arrays | 0.695000 | -0.105 |
| Thaps_hclust_0372 |
 |
 |
0.0016 |
0.064 |
18 |
lowFe_TMEVA | 0.072900 | 0.487 |
| Thaps_hclust_0372 |
 |
 |
0.0016 |
0.064 |
18 |
exponential_vs_stationary_24light | 0.318000 | 0.349 |
| Thaps_hclust_0372 |
 |
 |
0.0016 |
0.064 |
18 |
lowN_TMEVA | 0.122000 | -0.53 |
| Thaps_hclust_0372 |
 |
 |
0.0016 |
0.064 |
18 |
diel_exponential_vs_stationary | 0.884000 | 0.0366 |
| Thaps_hclust_0372 |
 |
 |
0.0016 |
0.064 |
18 |
lowSi_TMEVA | 0.939000 | 0.163 |
| Thaps_hclust_0372 |
 |
 |
0.0016 |
0.064 |
18 |
highlight_arrays | 0.151000 | -0.246 |
| Thaps_hclust_0372 |
 |
 |
0.0016 |
0.064 |
18 |
diel_light_vs_dark | 0.000485 | 1.47 |
| Thaps_hclust_0372 |
 |
 |
0.0016 |
0.064 |
18 |
lowFe_KTKB_Day3 | 0.464000 | 0.202 |
| Thaps_hclust_0372 |
 |
 |
0.0016 |
0.064 |
18 |
lowFe_KTKB_Day5 | 0.650000 | 0.106 |
| Thaps_hclust_0372 |
 |
 |
0.0016 |
0.064 |
18 |
BaP | 0.994000 | -0.00461 |
| Title | Cluster Plot | Dendrogram | e-value | e-value | e-value | Condition | Condition FDR | Condition Difference |
|---|---|---|---|---|---|---|---|---|
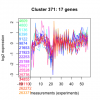
| Thaps_hclust_0371 |
 |
 |
0.0051 |
0.11 |
1.1 |
BaP | 0.001030 | -0.734 |
| Thaps_hclust_0371 |
 |
 |
0.0051 |
0.11 |
1.1 |
exponential_vs_stationary_24highlight | 0.997000 | -0.000745 |
| Thaps_hclust_0371 |
 |
 |
0.0051 |
0.11 |
1.1 |
co2_elevated_stat_arrays | 0.940000 | -0.0237 |
| Thaps_hclust_0371 |
 |
 |
0.0051 |
0.11 |
1.1 |
lowtemp_TMEVA | 0.070200 | 0.506 |
| Thaps_hclust_0371 |
 |
 |
0.0051 |
0.11 |
1.1 |
highpH_TMEVA | 0.000725 | -1.02 |
| Thaps_hclust_0371 |
 |
 |
0.0051 |
0.11 |
1.1 |
co2_elevated_expo_arrays | 0.478000 | 0.149 |
| Thaps_hclust_0371 |
 |
 |
0.0051 |
0.11 |
1.1 |
lowFe_TMEVA | 0.990000 | 0.0104 |
| Thaps_hclust_0371 |
 |
 |
0.0051 |
0.11 |
1.1 |
exponential_vs_stationary_24light | 0.515000 | 0.245 |
| Thaps_hclust_0371 |
 |
 |
0.0051 |
0.11 |
1.1 |
lowN_TMEVA | 0.120000 | -0.533 |
| Thaps_hclust_0371 |
 |
 |
0.0051 |
0.11 |
1.1 |
diel_exponential_vs_stationary | 0.536000 | -0.135 |
| Thaps_hclust_0371 |
 |
 |
0.0051 |
0.11 |
1.1 |
lowSi_TMEVA | 0.976000 | -0.128 |
| Thaps_hclust_0371 |
 |
 |
0.0051 |
0.11 |
1.1 |
highlight_arrays | 0.018000 | -0.404 |
| Thaps_hclust_0371 |
 |
 |
0.0051 |
0.11 |
1.1 |
diel_light_vs_dark | 0.000485 | 1.11 |
| Thaps_hclust_0371 |
 |
 |
0.0051 |
0.11 |
1.1 |
lowFe_KTKB_Day3 | 0.962000 | 0.0176 |
| Thaps_hclust_0371 |
 |
 |
0.0051 |
0.11 |
1.1 |
lowFe_KTKB_Day5 | 0.093800 | -0.358 |
| Title | Cluster Plot | Dendrogram | e-value | e-value | e-value | Condition | Condition FDR | Condition Difference |
|---|---|---|---|---|---|---|---|---|
| Thaps_hclust_0370 |
 |
 |
0.55 |
1 |
7 |
lowFe_KTKB_Day5 | 0.606000 | 0.111 |
| Thaps_hclust_0370 |
 |
 |
0.55 |
1 |
7 |
BaP | 0.055700 | 0.374 |
| Thaps_hclust_0370 |
 |
 |
0.55 |
1 |
7 |
exponential_vs_stationary_24highlight | 0.021800 | -0.23 |
| Thaps_hclust_0370 |
 |
 |
0.55 |
1 |
7 |
co2_elevated_stat_arrays | 0.316000 | -0.227 |
| Thaps_hclust_0370 |
 |
 |
0.55 |
1 |
7 |
lowtemp_TMEVA | 0.041600 | -0.49 |
| Thaps_hclust_0370 |
 |
 |
0.55 |
1 |
7 |
highpH_TMEVA | 0.000725 | -0.688 |
| Thaps_hclust_0370 |
 |
 |
0.55 |
1 |
7 |
co2_elevated_expo_arrays | 0.544000 | 0.128 |
| Thaps_hclust_0370 |
 |
 |
0.55 |
1 |
7 |
lowFe_TMEVA | 0.029100 | 0.528 |
| Thaps_hclust_0370 |
 |
 |
0.55 |
1 |
7 |
exponential_vs_stationary_24light | 0.468000 | -0.242 |
| Thaps_hclust_0370 |
 |
 |
0.55 |
1 |
7 |
lowN_TMEVA | 0.153000 | -0.452 |
| Thaps_hclust_0370 |
 |
 |
0.55 |
1 |
7 |
diel_exponential_vs_stationary | 0.002530 | -0.452 |
| Thaps_hclust_0370 |
 |
 |
0.55 |
1 |
7 |
lowSi_TMEVA | 1.000000 | 0.0794 |
| Thaps_hclust_0370 |
 |
 |
0.55 |
1 |
7 |
highlight_arrays | 0.704000 | -0.0666 |
| Thaps_hclust_0370 |
 |
 |
0.55 |
1 |
7 |
diel_light_vs_dark | 0.000485 | 1.04 |
| Thaps_hclust_0370 |
 |
 |
0.55 |
1 |
7 |
lowFe_KTKB_Day3 | 0.593000 | -0.139 |
| Title | Cluster Plot | Dendrogram | e-value | e-value | e-value | Condition | Condition FDR | Condition Difference |
|---|---|---|---|---|---|---|---|---|
| Thaps_hclust_0369 |
 |
 |
0.34 |
2.4 |
5 |
lowFe_KTKB_Day3 | 0.811000 | -0.0717 |
| Thaps_hclust_0369 |
 |
 |
0.34 |
2.4 |
5 |
lowFe_KTKB_Day5 | 0.689000 | 0.0944 |
| Thaps_hclust_0369 |
 |
 |
0.34 |
2.4 |
5 |
BaP | 0.562000 | -0.153 |
| Thaps_hclust_0369 |
 |
 |
0.34 |
2.4 |
5 |
exponential_vs_stationary_24highlight | 0.924000 | -0.0156 |
| Thaps_hclust_0369 |
 |
 |
0.34 |
2.4 |
5 |
co2_elevated_stat_arrays | 0.774000 | 0.0816 |
| Thaps_hclust_0369 |
 |
 |
0.34 |
2.4 |
5 |
lowtemp_TMEVA | 0.520000 | -0.181 |
| Thaps_hclust_0369 |
 |
 |
0.34 |
2.4 |
5 |
highpH_TMEVA | 0.000725 | -1.04 |
| Thaps_hclust_0369 |
 |
 |
0.34 |
2.4 |
5 |
co2_elevated_expo_arrays | 0.016400 | 0.333 |
| Thaps_hclust_0369 |
 |
 |
0.34 |
2.4 |
5 |
lowFe_TMEVA | 0.215000 | 0.368 |
| Thaps_hclust_0369 |
 |
 |
0.34 |
2.4 |
5 |
exponential_vs_stationary_24light | 0.791000 | 0.116 |
| Thaps_hclust_0369 |
 |
 |
0.34 |
2.4 |
5 |
lowN_TMEVA | 0.818000 | 0.091 |
| Thaps_hclust_0369 |
 |
 |
0.34 |
2.4 |
5 |
diel_exponential_vs_stationary | 0.000602 | -0.626 |
| Thaps_hclust_0369 |
 |
 |
0.34 |
2.4 |
5 |
lowSi_TMEVA | 0.918000 | -0.176 |
| Thaps_hclust_0369 |
 |
 |
0.34 |
2.4 |
5 |
highlight_arrays | 0.881000 | -0.0299 |
| Thaps_hclust_0369 |
 |
 |
0.34 |
2.4 |
5 |
diel_light_vs_dark | 0.000485 | 1.32 |
| Title | Cluster Plot | Dendrogram | e-value | e-value | e-value | Condition | Condition FDR | Condition Difference |
|---|---|---|---|---|---|---|---|---|
| Thaps_hclust_0368 |
 |
 |
0.0078 |
2.5 |
3.1 |
lowFe_KTKB_Day3 | 0.149000 | 0.453 |
| Thaps_hclust_0368 |
 |
 |
0.0078 |
2.5 |
3.1 |
lowFe_KTKB_Day5 | 0.274000 | 0.295 |
| Thaps_hclust_0368 |
 |
 |
0.0078 |
2.5 |
3.1 |
BaP | 0.449000 | 0.233 |
| Thaps_hclust_0368 |
 |
 |
0.0078 |
2.5 |
3.1 |
exponential_vs_stationary_24highlight | 0.000526 | -0.588 |
| Thaps_hclust_0368 |
 |
 |
0.0078 |
2.5 |
3.1 |
co2_elevated_stat_arrays | 0.000658 | 0.971 |
| Thaps_hclust_0368 |
 |
 |
0.0078 |
2.5 |
3.1 |
lowtemp_TMEVA | 0.082900 | 0.598 |
| Thaps_hclust_0368 |
 |
 |
0.0078 |
2.5 |
3.1 |
highpH_TMEVA | 0.079900 | -0.361 |
| Thaps_hclust_0368 |
 |
 |
0.0078 |
2.5 |
3.1 |
co2_elevated_expo_arrays | 0.545000 | 0.154 |
| Thaps_hclust_0368 |
 |
 |
0.0078 |
2.5 |
3.1 |
lowFe_TMEVA | 0.316000 | -0.341 |
| Thaps_hclust_0368 |
 |
 |
0.0078 |
2.5 |
3.1 |
exponential_vs_stationary_24light | 0.750000 | -0.158 |
| Thaps_hclust_0368 |
 |
 |
0.0078 |
2.5 |
3.1 |
lowN_TMEVA | 0.139000 | -0.607 |
| Thaps_hclust_0368 |
 |
 |
0.0078 |
2.5 |
3.1 |
diel_exponential_vs_stationary | 0.012600 | -0.617 |
| Thaps_hclust_0368 |
 |
 |
0.0078 |
2.5 |
3.1 |
lowSi_TMEVA | 0.065500 | -0.932 |
| Thaps_hclust_0368 |
 |
 |
0.0078 |
2.5 |
3.1 |
highlight_arrays | 0.303000 | -0.223 |
| Thaps_hclust_0368 |
 |
 |
0.0078 |
2.5 |
3.1 |
diel_light_vs_dark | 0.224000 | 0.347 |
| Title | Cluster Plot | Dendrogram | e-value | e-value | e-value | Condition | Condition FDR | Condition Difference |
|---|---|---|---|---|---|---|---|---|
| Thaps_hclust_0367 |
 |
 |
0.027 |
0.079 |
0.86 |
diel_light_vs_dark | 0.000485 | 0.845 |
| Thaps_hclust_0367 |
 |
 |
0.027 |
0.079 |
0.86 |
lowFe_KTKB_Day3 | 0.718000 | 0.117 |
| Thaps_hclust_0367 |
 |
 |
0.027 |
0.079 |
0.86 |
lowFe_KTKB_Day5 | 0.328000 | 0.235 |
| Thaps_hclust_0367 |
 |
 |
0.027 |
0.079 |
0.86 |
BaP | 0.000370 | 0.871 |
| Thaps_hclust_0367 |
 |
 |
0.027 |
0.079 |
0.86 |
exponential_vs_stationary_24highlight | 0.224000 | -0.152 |
