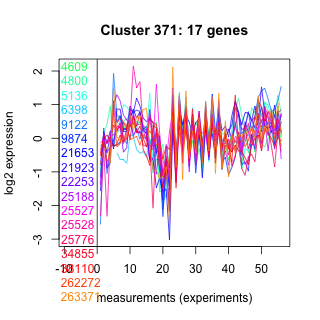
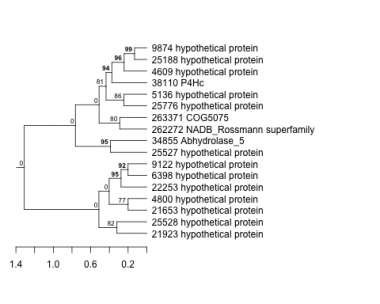
Thaps_hclust_0371 Hierarchical Clustering
Thalassiosira pseudonana
| GO ID | Go Term | p-value | q-value | Cluster |
|---|---|---|---|---|
| GO:0019538 | protein metabolism | 0.0189316 | 1 | Thaps_hclust_0371 |
| GO:0008152 | metabolism | 0.161222 | 1 | Thaps_hclust_0371 |
|
4609 : hypothetical protein |
9874 : hypothetical protein |
25188 : hypothetical protein |
34855 : Abhydrolase_5 |
|
4800 : hypothetical protein |
21653 : hypothetical protein |
25527 : hypothetical protein |
38110 : P4Hc |
|
5136 : hypothetical protein |
21923 : hypothetical protein |
25528 : hypothetical protein |
262272 : NADB_Rossmann superfamily |
|
6398 : hypothetical protein |
22253 : hypothetical protein |
25776 : hypothetical protein |
263371 : COG5075 |
|
9122 : hypothetical protein |
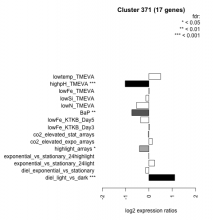
| Condition | Condition | Difference | FDR |
|---|---|---|---|
| diel_light_vs_dark | diel_light_vs_dark | 1.110 | 0.000485 |
| lowFe_KTKB_Day3 | lowFe_KTKB_Day3 | 0.018 | 0.962 |
| lowFe_KTKB_Day5 | lowFe_KTKB_Day5 | -0.358 | 0.0938 |
| BaP | BaP | -0.734 | 0.00103 |
| exponential_vs_stationary_24highlight | exponential_vs_stationary_24highlight | -0.001 | 0.997 |
| co2_elevated_stat_arrays | co2_elevated_stat_arrays | -0.024 | 0.94 |
| lowtemp_TMEVA | lowtemp_TMEVA | 0.506 | 0.0702 |
| highpH_TMEVA | highpH_TMEVA | -1.020 | 0.000725 |
| co2_elevated_expo_arrays | co2_elevated_expo_arrays | 0.149 | 0.478 |
| lowFe_TMEVA | lowFe_TMEVA | 0.010 | 0.99 |
| exponential_vs_stationary_24light | exponential_vs_stationary_24light | 0.245 | 0.515 |
| lowN_TMEVA | lowN_TMEVA | -0.533 | 0.12 |
| diel_exponential_vs_stationary | diel_exponential_vs_stationary | -0.135 | 0.536 |
| lowSi_TMEVA | lowSi_TMEVA | -0.128 | 0.976 |
| highlight_arrays | highlight_arrays | -0.404 | 0.018 |


