Hierarchical Clusters
Displaying 2501 - 2600 of 7500
| Title | Cluster Plot | Dendrogram | e-value | e-value | e-value | Condition | Condition FDR | Condition Difference |
|---|---|---|---|---|---|---|---|---|
| Thaps_hclust_0334 |
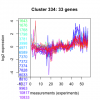 |
 |
0.51 |
0.00047 |
0.25 |
lowFe_KTKB_Day3 | 0.000862 | -0.701 |
| Thaps_hclust_0334 |
 |
 |
0.51 |
0.00047 |
0.25 |
lowFe_KTKB_Day5 | 0.002440 | -0.486 |
| Thaps_hclust_0334 |
 |
 |
0.51 |
0.00047 |
0.25 |
BaP | 0.000370 | -0.642 |
| Thaps_hclust_0334 |
 |
 |
0.51 |
0.00047 |
0.25 |
exponential_vs_stationary_24highlight | 0.000526 | -0.446 |
| Thaps_hclust_0334 |
 |
 |
0.51 |
0.00047 |
0.25 |
co2_elevated_stat_arrays | 0.154000 | 0.272 |
| Title | Cluster Plot | Dendrogram | e-value | e-value | e-value | Condition | Condition FDR | Condition Difference |
|---|---|---|---|---|---|---|---|---|
| Thaps_hclust_0333 |
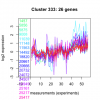 |
 |
0.00062 |
4 |
17 |
co2_elevated_stat_arrays | 0.642000 | 0.12 |
| Thaps_hclust_0333 |
 |
 |
0.00062 |
4 |
17 |
lowtemp_TMEVA | 0.792000 | -0.0706 |
| Thaps_hclust_0333 |
 |
 |
0.00062 |
4 |
17 |
highpH_TMEVA | 0.112000 | -0.222 |
| Thaps_hclust_0333 |
 |
 |
0.00062 |
4 |
17 |
co2_elevated_expo_arrays | 0.600000 | 0.114 |
| Thaps_hclust_0333 |
 |
 |
0.00062 |
4 |
17 |
lowFe_TMEVA | 0.997000 | -0.00209 |
| Thaps_hclust_0333 |
 |
 |
0.00062 |
4 |
17 |
exponential_vs_stationary_24light | 0.013500 | -0.667 |
| Thaps_hclust_0333 |
 |
 |
0.00062 |
4 |
17 |
lowN_TMEVA | 0.351000 | 0.294 |
| Thaps_hclust_0333 |
 |
 |
0.00062 |
4 |
17 |
diel_exponential_vs_stationary | 0.010000 | -0.376 |
| Thaps_hclust_0333 |
 |
 |
0.00062 |
4 |
17 |
lowSi_TMEVA | 0.776000 | 0.257 |
| Thaps_hclust_0333 |
 |
 |
0.00062 |
4 |
17 |
highlight_arrays | 0.377000 | 0.131 |
| Thaps_hclust_0333 |
 |
 |
0.00062 |
4 |
17 |
diel_light_vs_dark | 0.012500 | -0.437 |
| Thaps_hclust_0333 |
 |
 |
0.00062 |
4 |
17 |
lowFe_KTKB_Day3 | 0.139000 | 0.304 |
| Thaps_hclust_0333 |
 |
 |
0.00062 |
4 |
17 |
lowFe_KTKB_Day5 | 0.095200 | 0.294 |
| Thaps_hclust_0333 |
 |
 |
0.00062 |
4 |
17 |
BaP | 0.044400 | -0.37 |
| Thaps_hclust_0333 |
 |
 |
0.00062 |
4 |
17 |
exponential_vs_stationary_24highlight | 0.000926 | -0.306 |
| Title | Cluster Plot | Dendrogram | e-value | e-value | e-value | Condition | Condition FDR | Condition Difference |
|---|---|---|---|---|---|---|---|---|
| Thaps_hclust_0332 |
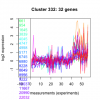 |
 |
0.000000055 |
0.0000013 |
0.0037 |
exponential_vs_stationary_24highlight | 0.000526 | -0.451 |
| Thaps_hclust_0332 |
 |
 |
0.000000055 |
0.0000013 |
0.0037 |
co2_elevated_stat_arrays | 0.178000 | 0.263 |
| Thaps_hclust_0332 |
 |
 |
0.000000055 |
0.0000013 |
0.0037 |
lowtemp_TMEVA | 0.345000 | 0.197 |
| Thaps_hclust_0332 |
 |
 |
0.000000055 |
0.0000013 |
0.0037 |
highpH_TMEVA | 0.006190 | -0.351 |
| Thaps_hclust_0332 |
 |
 |
0.000000055 |
0.0000013 |
0.0037 |
co2_elevated_expo_arrays | 0.412000 | 0.138 |
| Thaps_hclust_0332 |
 |
 |
0.000000055 |
0.0000013 |
0.0037 |
lowFe_TMEVA | 0.315000 | -0.241 |
| Thaps_hclust_0332 |
 |
 |
0.000000055 |
0.0000013 |
0.0037 |
exponential_vs_stationary_24light | 0.000581 | -1.04 |
| Thaps_hclust_0332 |
 |
 |
0.000000055 |
0.0000013 |
0.0037 |
lowN_TMEVA | 0.469000 | 0.234 |
| Thaps_hclust_0332 |
 |
 |
0.000000055 |
0.0000013 |
0.0037 |
diel_exponential_vs_stationary | 0.057400 | -0.262 |
| Thaps_hclust_0332 |
 |
 |
0.000000055 |
0.0000013 |
0.0037 |
lowSi_TMEVA | 1.000000 | -0.0301 |
| Thaps_hclust_0332 |
 |
 |
0.000000055 |
0.0000013 |
0.0037 |
highlight_arrays | 0.019300 | 0.289 |
| Thaps_hclust_0332 |
 |
 |
0.000000055 |
0.0000013 |
0.0037 |
diel_light_vs_dark | 0.629000 | 0.0995 |
| Thaps_hclust_0332 |
 |
 |
0.000000055 |
0.0000013 |
0.0037 |
lowFe_KTKB_Day3 | 0.265000 | -0.215 |
| Thaps_hclust_0332 |
 |
 |
0.000000055 |
0.0000013 |
0.0037 |
lowFe_KTKB_Day5 | 0.502000 | -0.114 |
| Thaps_hclust_0332 |
 |
 |
0.000000055 |
0.0000013 |
0.0037 |
BaP | 0.796000 | -0.0518 |
| Title | Cluster Plot | Dendrogram | e-value | e-value | e-value | Condition | Condition FDR | Condition Difference |
|---|---|---|---|---|---|---|---|---|
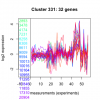
| Thaps_hclust_0331 |
 |
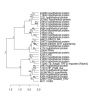 |
0.000000000011 |
20 |
1600 |
BaP | 0.835000 | -0.0438 |
| Thaps_hclust_0331 |
 |
 |
0.000000000011 |
20 |
1600 |
exponential_vs_stationary_24highlight | 0.000526 | -0.636 |
| Thaps_hclust_0331 |
 |
 |
0.000000000011 |
20 |
1600 |
co2_elevated_stat_arrays | 0.000658 | 0.948 |
| Thaps_hclust_0331 |
 |
 |
0.000000000011 |
20 |
1600 |
lowtemp_TMEVA | 0.218000 | -0.248 |
| Thaps_hclust_0331 |
 |
 |
0.000000000011 |
20 |
1600 |
highpH_TMEVA | 0.006190 | -0.352 |
| Thaps_hclust_0331 |
 |
 |
0.000000000011 |
20 |
1600 |
co2_elevated_expo_arrays | 0.011800 | 0.258 |
| Thaps_hclust_0331 |
 |
 |
0.000000000011 |
20 |
1600 |
lowFe_TMEVA | 0.133000 | -0.327 |
| Thaps_hclust_0331 |
 |
 |
0.000000000011 |
20 |
1600 |
exponential_vs_stationary_24light | 0.000581 | -1.09 |
| Thaps_hclust_0331 |
 |
 |
0.000000000011 |
20 |
1600 |
lowN_TMEVA | 0.712000 | -0.137 |
| Thaps_hclust_0331 |
 |
 |
0.000000000011 |
20 |
1600 |
diel_exponential_vs_stationary | 0.012400 | -0.331 |
| Thaps_hclust_0331 |
 |
 |
0.000000000011 |
20 |
1600 |
lowSi_TMEVA | 0.986000 | -0.116 |
| Thaps_hclust_0331 |
 |
 |
0.000000000011 |
20 |
1600 |
highlight_arrays | 0.000442 | 1.18 |
| Thaps_hclust_0331 |
 |
 |
0.000000000011 |
20 |
1600 |
diel_light_vs_dark | 0.012500 | -0.378 |
| Thaps_hclust_0331 |
 |
 |
0.000000000011 |
20 |
1600 |
lowFe_KTKB_Day3 | 0.157000 | -0.258 |
| Thaps_hclust_0331 |
 |
 |
0.000000000011 |
20 |
1600 |
lowFe_KTKB_Day5 | 0.639000 | -0.0834 |
| Title | Cluster Plot | Dendrogram | e-value | e-value | e-value | Condition | Condition FDR | Condition Difference |
|---|---|---|---|---|---|---|---|---|
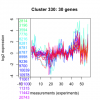
| Thaps_hclust_0330 |
 |
 |
0.0000058 |
0.00000085 |
0.000041 |
lowFe_KTKB_Day5 | 0.156000 | -0.23 |
| Thaps_hclust_0330 |
 |
 |
0.0000058 |
0.00000085 |
0.000041 |
BaP | 0.000370 | -0.919 |
| Thaps_hclust_0330 |
 |
 |
0.0000058 |
0.00000085 |
0.000041 |
exponential_vs_stationary_24highlight | 0.000526 | -0.827 |
| Thaps_hclust_0330 |
 |
 |
0.0000058 |
0.00000085 |
0.000041 |
co2_elevated_stat_arrays | 0.003090 | 0.507 |
| Thaps_hclust_0330 |
 |
 |
0.0000058 |
0.00000085 |
0.000041 |
lowtemp_TMEVA | 0.999000 | -0.00329 |
| Thaps_hclust_0330 |
 |
 |
0.0000058 |
0.00000085 |
0.000041 |
highpH_TMEVA | 0.000725 | 0.422 |
| Thaps_hclust_0330 |
 |
 |
0.0000058 |
0.00000085 |
0.000041 |
co2_elevated_expo_arrays | 0.024600 | 0.257 |
| Thaps_hclust_0330 |
 |
 |
0.0000058 |
0.00000085 |
0.000041 |
lowFe_TMEVA | 0.216000 | 0.293 |
| Thaps_hclust_0330 |
 |
 |
0.0000058 |
0.00000085 |
0.000041 |
exponential_vs_stationary_24light | 0.000581 | -1.85 |
| Thaps_hclust_0330 |
 |
 |
0.0000058 |
0.00000085 |
0.000041 |
lowN_TMEVA | 0.015300 | 0.599 |
| Thaps_hclust_0330 |
 |
 |
0.0000058 |
0.00000085 |
0.000041 |
diel_exponential_vs_stationary | 0.002970 | -0.42 |
| Thaps_hclust_0330 |
 |
 |
0.0000058 |
0.00000085 |
0.000041 |
lowSi_TMEVA | 0.368000 | 0.416 |
| Thaps_hclust_0330 |
 |
 |
0.0000058 |
0.00000085 |
0.000041 |
highlight_arrays | 0.000442 | 0.989 |
| Thaps_hclust_0330 |
 |
 |
0.0000058 |
0.00000085 |
0.000041 |
diel_light_vs_dark | 0.000485 | -0.57 |
| Thaps_hclust_0330 |
 |
 |
0.0000058 |
0.00000085 |
0.000041 |
lowFe_KTKB_Day3 | 0.023900 | -0.398 |
| Title | Cluster Plot | Dendrogram | e-value | e-value | e-value | Condition | Condition FDR | Condition Difference |
|---|---|---|---|---|---|---|---|---|
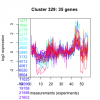
| Thaps_hclust_0329 |
 |
 |
0.0000000004 |
0.00000034 |
0.000023 |
lowFe_KTKB_Day3 | 0.795000 | -0.057 |
| Thaps_hclust_0329 |
 |
 |
0.0000000004 |
0.00000034 |
0.000023 |
lowFe_KTKB_Day5 | 0.229000 | -0.185 |
| Thaps_hclust_0329 |
 |
 |
0.0000000004 |
0.00000034 |
0.000023 |
BaP | 0.566000 | 0.104 |
| Thaps_hclust_0329 |
 |
 |
0.0000000004 |
0.00000034 |
0.000023 |
exponential_vs_stationary_24highlight | 0.000526 | -0.293 |
| Thaps_hclust_0329 |
 |
 |
0.0000000004 |
0.00000034 |
0.000023 |
co2_elevated_stat_arrays | 0.000658 | 0.649 |
| Thaps_hclust_0329 |
 |
 |
0.0000000004 |
0.00000034 |
0.000023 |
lowtemp_TMEVA | 0.273000 | 0.217 |
| Thaps_hclust_0329 |
 |
 |
0.0000000004 |
0.00000034 |
0.000023 |
highpH_TMEVA | 0.011400 | 0.3 |
| Thaps_hclust_0329 |
 |
 |
0.0000000004 |
0.00000034 |
0.000023 |
co2_elevated_expo_arrays | 0.978000 | -0.019 |
| Thaps_hclust_0329 |
 |
 |
0.0000000004 |
0.00000034 |
0.000023 |
lowFe_TMEVA | 0.857000 | -0.0676 |
| Thaps_hclust_0329 |
 |
 |
0.0000000004 |
0.00000034 |
0.000023 |
exponential_vs_stationary_24light | 0.000581 | -0.76 |
| Thaps_hclust_0329 |
 |
 |
0.0000000004 |
0.00000034 |
0.000023 |
lowN_TMEVA | 0.416000 | 0.246 |
| Thaps_hclust_0329 |
 |
 |
0.0000000004 |
0.00000034 |
0.000023 |
diel_exponential_vs_stationary | 0.734000 | -0.0577 |
| Thaps_hclust_0329 |
 |
 |
0.0000000004 |
0.00000034 |
0.000023 |
lowSi_TMEVA | 1.000000 | 0.035 |
| Thaps_hclust_0329 |
 |
 |
0.0000000004 |
0.00000034 |
0.000023 |
highlight_arrays | 0.000442 | 0.768 |
| Thaps_hclust_0329 |
 |
 |
0.0000000004 |
0.00000034 |
0.000023 |
diel_light_vs_dark | 0.019300 | -0.344 |
| Title | Cluster Plot | Dendrogram | e-value | e-value | e-value | Condition | Condition FDR | Condition Difference |
|---|---|---|---|---|---|---|---|---|
| Thaps_hclust_0328 |
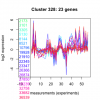 |
 |
0.00013 |
0.00001 |
0.46 |
diel_light_vs_dark | 0.000485 | -0.669 |
| Thaps_hclust_0328 |
 |
 |
0.00013 |
0.00001 |
0.46 |
lowFe_KTKB_Day3 | 0.302000 | 0.236 |
| Thaps_hclust_0328 |
 |
 |
0.00013 |
0.00001 |
0.46 |
lowFe_KTKB_Day5 | 0.007410 | 0.502 |
| Thaps_hclust_0328 |
 |
 |
0.00013 |
0.00001 |
0.46 |
BaP | 0.898000 | -0.0338 |
| Thaps_hclust_0328 |
 |
 |
0.00013 |
0.00001 |
0.46 |
exponential_vs_stationary_24highlight | 0.000926 | -0.31 |
| Thaps_hclust_0328 |
 |
 |
0.00013 |
0.00001 |
0.46 |
co2_elevated_stat_arrays | 0.000658 | 0.709 |
| Thaps_hclust_0328 |
 |
 |
0.00013 |
0.00001 |
0.46 |
lowtemp_TMEVA | 0.000735 | 1.36 |
| Thaps_hclust_0328 |
 |
 |
0.00013 |
0.00001 |
0.46 |
highpH_TMEVA | 0.052400 | -0.285 |
| Thaps_hclust_0328 |
 |
 |
0.00013 |
0.00001 |
0.46 |
co2_elevated_expo_arrays | 0.768000 | 0.0869 |
| Thaps_hclust_0328 |
 |
 |
0.00013 |
0.00001 |
0.46 |
lowFe_TMEVA | 0.534000 | -0.179 |
| Thaps_hclust_0328 |
 |
 |
0.00013 |
0.00001 |
0.46 |
exponential_vs_stationary_24light | 0.000581 | -0.918 |
| Thaps_hclust_0328 |
 |
 |
0.00013 |
0.00001 |
0.46 |
lowN_TMEVA | 0.001190 | 1.84 |
| Thaps_hclust_0328 |
 |
 |
0.00013 |
0.00001 |
0.46 |
diel_exponential_vs_stationary | 0.000602 | -1.06 |
| Thaps_hclust_0328 |
 |
 |
0.00013 |
0.00001 |
0.46 |
lowSi_TMEVA | 0.574000 | -0.346 |
| Thaps_hclust_0328 |
 |
 |
0.00013 |
0.00001 |
0.46 |
highlight_arrays | 0.276000 | 0.166 |
| Title | Cluster Plot | Dendrogram | e-value | e-value | e-value | Condition | Condition FDR | Condition Difference |
|---|---|---|---|---|---|---|---|---|
| Thaps_hclust_0327 |
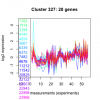 |
 |
0.0000000037 |
0.013 |
3.8 |
diel_light_vs_dark | 0.054800 | -0.316 |
| Thaps_hclust_0327 |
 |
 |
0.0000000037 |
0.013 |
3.8 |
lowFe_KTKB_Day3 | 0.689000 | 0.0936 |
| Thaps_hclust_0327 |
 |
 |
0.0000000037 |
0.013 |
3.8 |
lowFe_KTKB_Day5 | 0.584000 | 0.102 |
| Thaps_hclust_0327 |
 |
 |
0.0000000037 |
0.013 |
3.8 |
BaP | 0.086700 | -0.304 |
| Thaps_hclust_0327 |
 |
 |
0.0000000037 |
0.013 |
3.8 |
exponential_vs_stationary_24highlight | 0.003970 | -0.256 |
