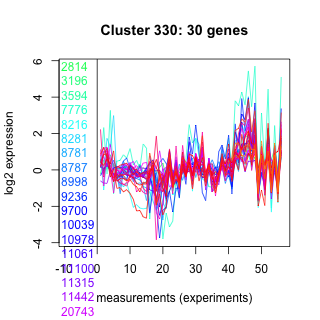
Thaps_hclust_0330 Hierarchical Clustering
Thalassiosira pseudonana
| Cluster Plot | Conditions Plot | Dendrogram |
|---|---|---|
 |
 |
 |
| GO ID | Go Term | p-value | q-value | Cluster |
|---|---|---|---|---|
| GO:0009058 | biosynthesis | 0.0226144 | 1 | Thaps_hclust_0330 |
| GO:0006355 | regulation of transcription, DNA-dependent | 0.122922 | 1 | Thaps_hclust_0330 |
|
2814 : Es2 superfamily |
8998 : Methyltransf_16 superfamily |
11442 : Reprolysin_3 |
25525 : hypothetical protein |
|
3196 : hypothetical protein |
9236 : hypothetical protein |
20743 : hypothetical protein |
25543 : hypothetical protein |
|
3594 : (Tp_CCHH24) regulator [Rayko] |
9700 : hypothetical protein |
23264 : hypothetical protein |
25697 : ANK |
|
7776 : hypothetical protein |
10039 : hypothetical protein |
23503 : ANK |
25890 : (Tp_HSF_2.7a) regulator [Rayko] |
|
8216 : hypothetical protein |
10978 : hypothetical protein |
24417 : CBM35_pectate_lyase-like |
263048 : hypothetical protein |
|
8281 : hypothetical protein |
11061 : hypothetical protein |
24961 : hypothetical protein |
bd690 : (bd690) NA |
|
8781 : hypothetical protein |
11100 : hypothetical protein |
25493 : hypothetical protein |
bd1841 : (bd1841) CAP10 superfamily |
|
8787 : hypothetical protein |
11315 : CAP10 superfamily |
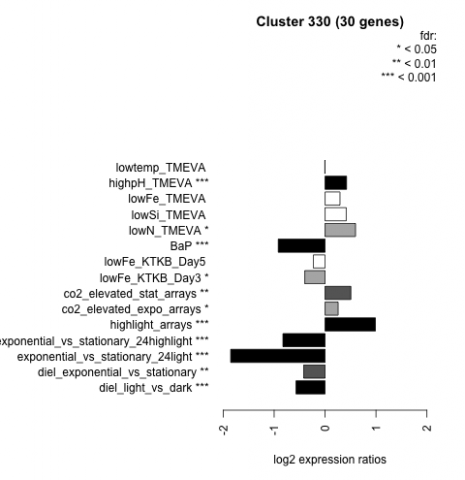
| Condition | Condition | Difference | FDR |
|---|---|---|---|
| diel_light_vs_dark | diel_light_vs_dark | -0.570 | 0.000485 |
| lowFe_KTKB_Day3 | lowFe_KTKB_Day3 | -0.398 | 0.0239 |
| lowFe_KTKB_Day5 | lowFe_KTKB_Day5 | -0.230 | 0.156 |
| BaP | BaP | -0.919 | 0.00037 |
| exponential_vs_stationary_24highlight | exponential_vs_stationary_24highlight | -0.827 | 0.000526 |
| co2_elevated_stat_arrays | co2_elevated_stat_arrays | 0.507 | 0.00309 |
| lowtemp_TMEVA | lowtemp_TMEVA | -0.003 | 0.999 |
| highpH_TMEVA | highpH_TMEVA | 0.422 | 0.000725 |
| co2_elevated_expo_arrays | co2_elevated_expo_arrays | 0.257 | 0.0246 |
| lowFe_TMEVA | lowFe_TMEVA | 0.293 | 0.216 |
| exponential_vs_stationary_24light | exponential_vs_stationary_24light | -1.850 | 0.000581 |
| lowN_TMEVA | lowN_TMEVA | 0.599 | 0.0153 |
| diel_exponential_vs_stationary | diel_exponential_vs_stationary | -0.420 | 0.00297 |
| lowSi_TMEVA | lowSi_TMEVA | 0.416 | 0.368 |
| highlight_arrays | highlight_arrays | 0.989 | 0.000442 |