Hierarchical Clusters
Displaying 3101 - 3200 of 7500
| Title | Cluster Plot | Dendrogram | e-value | e-value | e-value | Condition | Condition FDR | Condition Difference |
|---|---|---|---|---|---|---|---|---|
| Thaps_hclust_0294 |
 |
 |
0.0033 |
0.13 |
0.53 |
lowSi_TMEVA | 0.974000 | -0.146 |
| Thaps_hclust_0294 |
 |
 |
0.0033 |
0.13 |
0.53 |
highlight_arrays | 0.035700 | -0.325 |
| Thaps_hclust_0294 |
 |
 |
0.0033 |
0.13 |
0.53 |
diel_light_vs_dark | 0.731000 | -0.0904 |
| Thaps_hclust_0294 |
 |
 |
0.0033 |
0.13 |
0.53 |
lowFe_KTKB_Day3 | 0.509000 | 0.172 |
| Thaps_hclust_0294 |
 |
 |
0.0033 |
0.13 |
0.53 |
lowFe_KTKB_Day5 | 0.841000 | 0.0476 |
| Title | Cluster Plot | Dendrogram | e-value | e-value | e-value | Condition | Condition FDR | Condition Difference |
|---|---|---|---|---|---|---|---|---|
| Thaps_hclust_0293 |
 |
 |
0.16 |
120 |
360 |
lowFe_KTKB_Day5 | 0.964000 | 0.0113 |
| Thaps_hclust_0293 |
 |
 |
0.16 |
120 |
360 |
BaP | 0.043600 | 0.402 |
| Thaps_hclust_0293 |
 |
 |
0.16 |
120 |
360 |
exponential_vs_stationary_24highlight | 0.761000 | 0.0354 |
| Thaps_hclust_0293 |
 |
 |
0.16 |
120 |
360 |
co2_elevated_stat_arrays | 0.843000 | 0.0578 |
| Thaps_hclust_0293 |
 |
 |
0.16 |
120 |
360 |
lowtemp_TMEVA | 0.363000 | -0.234 |
| Thaps_hclust_0293 |
 |
 |
0.16 |
120 |
360 |
highpH_TMEVA | 0.357000 | -0.151 |
| Thaps_hclust_0293 |
 |
 |
0.16 |
120 |
360 |
co2_elevated_expo_arrays | 0.985000 | 0.0161 |
| Thaps_hclust_0293 |
 |
 |
0.16 |
120 |
360 |
lowFe_TMEVA | 0.534000 | -0.185 |
| Thaps_hclust_0293 |
 |
 |
0.16 |
120 |
360 |
exponential_vs_stationary_24light | 0.984000 | 0.00638 |
| Thaps_hclust_0293 |
 |
 |
0.16 |
120 |
360 |
lowN_TMEVA | 0.626000 | -0.182 |
| Thaps_hclust_0293 |
 |
 |
0.16 |
120 |
360 |
diel_exponential_vs_stationary | 0.860000 | 0.0414 |
| Thaps_hclust_0293 |
 |
 |
0.16 |
120 |
360 |
lowSi_TMEVA | 1.000000 | -0.0714 |
| Thaps_hclust_0293 |
 |
 |
0.16 |
120 |
360 |
highlight_arrays | 0.860000 | 0.0307 |
| Thaps_hclust_0293 |
 |
 |
0.16 |
120 |
360 |
diel_light_vs_dark | 0.955000 | -0.022 |
| Thaps_hclust_0293 |
 |
 |
0.16 |
120 |
360 |
lowFe_KTKB_Day3 | 0.777000 | -0.083 |
| Title | Cluster Plot | Dendrogram | e-value | e-value | e-value | Condition | Condition FDR | Condition Difference |
|---|---|---|---|---|---|---|---|---|
| Thaps_hclust_0292 |
 |
 |
1.4e-30 |
0.00000000000037 |
0.0000067 |
lowFe_KTKB_Day5 | 0.629000 | 0.0759 |
| Thaps_hclust_0292 |
 |
 |
1.4e-30 |
0.00000000000037 |
0.0000067 |
BaP | 0.326000 | 0.148 |
| Thaps_hclust_0292 |
 |
 |
1.4e-30 |
0.00000000000037 |
0.0000067 |
exponential_vs_stationary_24highlight | 0.556000 | 0.0464 |
| Thaps_hclust_0292 |
 |
 |
1.4e-30 |
0.00000000000037 |
0.0000067 |
co2_elevated_stat_arrays | 0.949000 | -0.0196 |
| Thaps_hclust_0292 |
 |
 |
1.4e-30 |
0.00000000000037 |
0.0000067 |
lowtemp_TMEVA | 0.028900 | 0.373 |
| Thaps_hclust_0292 |
 |
 |
1.4e-30 |
0.00000000000037 |
0.0000067 |
highpH_TMEVA | 0.301000 | -0.125 |
| Thaps_hclust_0292 |
 |
 |
1.4e-30 |
0.00000000000037 |
0.0000067 |
co2_elevated_expo_arrays | 0.985000 | 0.0103 |
| Thaps_hclust_0292 |
 |
 |
1.4e-30 |
0.00000000000037 |
0.0000067 |
lowFe_TMEVA | 0.736000 | -0.112 |
| Thaps_hclust_0292 |
 |
 |
1.4e-30 |
0.00000000000037 |
0.0000067 |
exponential_vs_stationary_24light | 0.989000 | 0.00306 |
| Thaps_hclust_0292 |
 |
 |
1.4e-30 |
0.00000000000037 |
0.0000067 |
lowN_TMEVA | 1.000000 | -0.0000565 |
| Thaps_hclust_0292 |
 |
 |
1.4e-30 |
0.00000000000037 |
0.0000067 |
diel_exponential_vs_stationary | 0.783000 | 0.0423 |
| Thaps_hclust_0292 |
 |
 |
1.4e-30 |
0.00000000000037 |
0.0000067 |
lowSi_TMEVA | 0.976000 | 0.154 |
| Thaps_hclust_0292 |
 |
 |
1.4e-30 |
0.00000000000037 |
0.0000067 |
highlight_arrays | 0.000442 | -0.341 |
| Thaps_hclust_0292 |
 |
 |
1.4e-30 |
0.00000000000037 |
0.0000067 |
diel_light_vs_dark | 0.476000 | -0.115 |
| Thaps_hclust_0292 |
 |
 |
1.4e-30 |
0.00000000000037 |
0.0000067 |
lowFe_KTKB_Day3 | 0.885000 | 0.0319 |
| Title | Cluster Plot | Dendrogram | e-value | e-value | e-value | Condition | Condition FDR | Condition Difference |
|---|---|---|---|---|---|---|---|---|
| Thaps_hclust_0291 |
 |
 |
0.000000049 |
0.000056 |
0.0000035 |
lowFe_KTKB_Day3 | 0.000862 | 0.618 |
| Thaps_hclust_0291 |
 |
 |
0.000000049 |
0.000056 |
0.0000035 |
lowFe_KTKB_Day5 | 0.744000 | 0.0664 |
| Thaps_hclust_0291 |
 |
 |
0.000000049 |
0.000056 |
0.0000035 |
BaP | 0.000370 | 0.963 |
| Thaps_hclust_0291 |
 |
 |
0.000000049 |
0.000056 |
0.0000035 |
exponential_vs_stationary_24highlight | 0.000526 | 0.332 |
| Thaps_hclust_0291 |
 |
 |
0.000000049 |
0.000056 |
0.0000035 |
co2_elevated_stat_arrays | 0.011200 | 0.437 |
| Thaps_hclust_0291 |
 |
 |
0.000000049 |
0.000056 |
0.0000035 |
lowtemp_TMEVA | 0.000735 | 0.954 |
| Thaps_hclust_0291 |
 |
 |
0.000000049 |
0.000056 |
0.0000035 |
highpH_TMEVA | 0.006930 | -0.369 |
| Thaps_hclust_0291 |
 |
 |
0.000000049 |
0.000056 |
0.0000035 |
co2_elevated_expo_arrays | 0.398000 | -0.144 |
| Thaps_hclust_0291 |
 |
 |
0.000000049 |
0.000056 |
0.0000035 |
lowFe_TMEVA | 0.379000 | 0.223 |
| Thaps_hclust_0291 |
 |
 |
0.000000049 |
0.000056 |
0.0000035 |
exponential_vs_stationary_24light | 0.034500 | 0.571 |
| Thaps_hclust_0291 |
 |
 |
0.000000049 |
0.000056 |
0.0000035 |
lowN_TMEVA | 0.761000 | -0.114 |
| Thaps_hclust_0291 |
 |
 |
0.000000049 |
0.000056 |
0.0000035 |
diel_exponential_vs_stationary | 0.175000 | 0.21 |
| Thaps_hclust_0291 |
 |
 |
0.000000049 |
0.000056 |
0.0000035 |
lowSi_TMEVA | 0.845000 | -0.21 |
| Thaps_hclust_0291 |
 |
 |
0.000000049 |
0.000056 |
0.0000035 |
highlight_arrays | 0.002840 | -0.394 |
| Thaps_hclust_0291 |
 |
 |
0.000000049 |
0.000056 |
0.0000035 |
diel_light_vs_dark | 0.000485 | 1.04 |
| Title | Cluster Plot | Dendrogram | e-value | e-value | e-value | Condition | Condition FDR | Condition Difference |
|---|---|---|---|---|---|---|---|---|
| Thaps_hclust_0290 |
 |
 |
3e-16 |
0.014 |
0.072 |
diel_light_vs_dark | 0.142000 | 0.284 |
| Thaps_hclust_0290 |
 |
 |
3e-16 |
0.014 |
0.072 |
lowFe_KTKB_Day3 | 0.272000 | 0.255 |
| Thaps_hclust_0290 |
 |
 |
3e-16 |
0.014 |
0.072 |
lowFe_KTKB_Day5 | 0.620000 | 0.107 |
| Thaps_hclust_0290 |
 |
 |
3e-16 |
0.014 |
0.072 |
BaP | 0.000370 | 0.863 |
| Thaps_hclust_0290 |
 |
 |
3e-16 |
0.014 |
0.072 |
exponential_vs_stationary_24highlight | 0.065900 | 0.184 |
| Thaps_hclust_0290 |
 |
 |
3e-16 |
0.014 |
0.072 |
co2_elevated_stat_arrays | 0.200000 | 0.279 |
| Thaps_hclust_0290 |
 |
 |
3e-16 |
0.014 |
0.072 |
lowtemp_TMEVA | 0.010000 | 0.658 |
| Thaps_hclust_0290 |
 |
 |
3e-16 |
0.014 |
0.072 |
highpH_TMEVA | 0.021300 | -0.346 |
| Thaps_hclust_0290 |
 |
 |
3e-16 |
0.014 |
0.072 |
co2_elevated_expo_arrays | 0.934000 | -0.0409 |
| Thaps_hclust_0290 |
 |
 |
3e-16 |
0.014 |
0.072 |
lowFe_TMEVA | 0.813000 | -0.0931 |
| Thaps_hclust_0290 |
 |
 |
3e-16 |
0.014 |
0.072 |
exponential_vs_stationary_24light | 0.212000 | 0.379 |
| Thaps_hclust_0290 |
 |
 |
3e-16 |
0.014 |
0.072 |
lowN_TMEVA | 0.359000 | -0.303 |
| Thaps_hclust_0290 |
 |
 |
3e-16 |
0.014 |
0.072 |
diel_exponential_vs_stationary | 0.044900 | 0.324 |
| Thaps_hclust_0290 |
 |
 |
3e-16 |
0.014 |
0.072 |
lowSi_TMEVA | 0.486000 | -0.399 |
| Thaps_hclust_0290 |
 |
 |
3e-16 |
0.014 |
0.072 |
highlight_arrays | 0.030500 | -0.32 |
| Title | Cluster Plot | Dendrogram | e-value | e-value | e-value | Condition | Condition FDR | Condition Difference |
|---|---|---|---|---|---|---|---|---|
| Thaps_hclust_0289 |
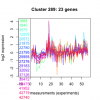 |
 |
0.0000000000026 |
0.00000000000025 |
0.0000045 |
diel_light_vs_dark | 0.000485 | 0.628 |
| Thaps_hclust_0289 |
 |
 |
0.0000000000026 |
0.00000000000025 |
0.0000045 |
lowFe_KTKB_Day3 | 0.001610 | 0.617 |
| Thaps_hclust_0289 |
 |
 |
0.0000000000026 |
0.00000000000025 |
0.0000045 |
lowFe_KTKB_Day5 | 0.400000 | 0.164 |
| Thaps_hclust_0289 |
 |
 |
0.0000000000026 |
0.00000000000025 |
0.0000045 |
BaP | 0.001030 | 0.646 |
| Thaps_hclust_0289 |
 |
 |
0.0000000000026 |
0.00000000000025 |
0.0000045 |
exponential_vs_stationary_24highlight | 0.195000 | 0.131 |
| Thaps_hclust_0289 |
 |
 |
0.0000000000026 |
0.00000000000025 |
0.0000045 |
co2_elevated_stat_arrays | 0.102000 | 0.341 |
| Thaps_hclust_0289 |
 |
 |
0.0000000000026 |
0.00000000000025 |
0.0000045 |
lowtemp_TMEVA | 0.748000 | 0.0861 |
| Thaps_hclust_0289 |
 |
 |
0.0000000000026 |
0.00000000000025 |
0.0000045 |
highpH_TMEVA | 0.008100 | -0.387 |
| Thaps_hclust_0289 |
 |
 |
0.0000000000026 |
0.00000000000025 |
0.0000045 |
co2_elevated_expo_arrays | 0.235000 | -0.184 |
| Thaps_hclust_0289 |
 |
 |
0.0000000000026 |
0.00000000000025 |
0.0000045 |
lowFe_TMEVA | 0.975000 | 0.0179 |
| Thaps_hclust_0289 |
 |
 |
0.0000000000026 |
0.00000000000025 |
0.0000045 |
exponential_vs_stationary_24light | 0.799000 | 0.101 |
| Thaps_hclust_0289 |
 |
 |
0.0000000000026 |
0.00000000000025 |
0.0000045 |
lowN_TMEVA | 0.789000 | 0.0987 |
| Thaps_hclust_0289 |
 |
 |
0.0000000000026 |
0.00000000000025 |
0.0000045 |
diel_exponential_vs_stationary | 0.783000 | 0.0576 |
| Thaps_hclust_0289 |
 |
 |
0.0000000000026 |
0.00000000000025 |
0.0000045 |
lowSi_TMEVA | 0.649000 | -0.306 |
| Thaps_hclust_0289 |
 |
 |
0.0000000000026 |
0.00000000000025 |
0.0000045 |
highlight_arrays | 0.489000 | -0.11 |
| Title | Cluster Plot | Dendrogram | e-value | e-value | e-value | Condition | Condition FDR | Condition Difference |
|---|---|---|---|---|---|---|---|---|
| Thaps_hclust_0288 |
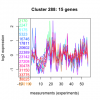 |
 |
0.032 |
0.0067 |
0.047 |
highlight_arrays | 0.002840 | -0.513 |
| Thaps_hclust_0288 |
 |
 |
0.032 |
0.0067 |
0.047 |
diel_light_vs_dark | 0.357000 | -0.235 |
| Thaps_hclust_0288 |
 |
 |
0.032 |
0.0067 |
0.047 |
lowFe_KTKB_Day3 | 0.244000 | 0.319 |
| Thaps_hclust_0288 |
 |
 |
0.032 |
0.0067 |
0.047 |
lowFe_KTKB_Day5 | 0.027000 | 0.485 |
| Thaps_hclust_0288 |
 |
 |
0.032 |
0.0067 |
0.047 |
BaP | 0.537000 | 0.167 |
| Thaps_hclust_0288 |
 |
 |
0.032 |
0.0067 |
0.047 |
exponential_vs_stationary_24highlight | 0.007520 | 0.315 |
| Thaps_hclust_0288 |
 |
 |
0.032 |
0.0067 |
0.047 |
co2_elevated_stat_arrays | 0.332000 | 0.246 |
| Thaps_hclust_0288 |
 |
 |
0.032 |
0.0067 |
0.047 |
lowtemp_TMEVA | 0.042100 | 0.587 |
| Thaps_hclust_0288 |
 |
 |
0.032 |
0.0067 |
0.047 |
highpH_TMEVA | 0.042600 | -0.362 |
| Thaps_hclust_0288 |
 |
 |
0.032 |
0.0067 |
0.047 |
co2_elevated_expo_arrays | 0.580000 | 0.133 |
| Thaps_hclust_0288 |
 |
 |
0.032 |
0.0067 |
0.047 |
lowFe_TMEVA | 0.422000 | 0.25 |
| Thaps_hclust_0288 |
 |
 |
0.032 |
0.0067 |
0.047 |
exponential_vs_stationary_24light | 0.040900 | 0.713 |
| Thaps_hclust_0288 |
 |
 |
0.032 |
0.0067 |
0.047 |
lowN_TMEVA | 0.784000 | -0.11 |
| Thaps_hclust_0288 |
 |
 |
0.032 |
0.0067 |
0.047 |
diel_exponential_vs_stationary | 0.024000 | 0.45 |
| Thaps_hclust_0288 |
 |
 |
0.032 |
0.0067 |
0.047 |
lowSi_TMEVA | 0.976000 | -0.134 |
| Title | Cluster Plot | Dendrogram | e-value | e-value | e-value | Condition | Condition FDR | Condition Difference |
|---|---|---|---|---|---|---|---|---|
| Thaps_hclust_0287 |
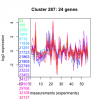 |
 |
0.0000001 |
0.00007 |
0.003 |
lowSi_TMEVA | 0.329000 | -0.462 |
| Thaps_hclust_0287 |
 |
 |
0.0000001 |
0.00007 |
0.003 |
highlight_arrays | 0.039300 | -0.296 |
| Thaps_hclust_0287 |
 |
 |
0.0000001 |
0.00007 |
0.003 |
diel_light_vs_dark | 0.697000 | -0.0954 |
| Thaps_hclust_0287 |
 |
 |
0.0000001 |
0.00007 |
0.003 |
lowFe_KTKB_Day3 | 0.000862 | 0.802 |
| Thaps_hclust_0287 |
 |
 |
0.0000001 |
0.00007 |
0.003 |
lowFe_KTKB_Day5 | 0.004170 | 0.482 |
