Hierarchical Clusters
Displaying 3901 - 4000 of 7500
| Title | Cluster Plot | Dendrogram | e-value | e-value | e-value | Condition | Condition FDR | Condition Difference |
|---|---|---|---|---|---|---|---|---|
| Thaps_hclust_0240 |
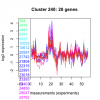 |
 |
0.000000064 |
0.000021 |
0.00078 |
lowFe_KTKB_Day3 | 0.601000 | 0.119 |
| Thaps_hclust_0240 |
 |
 |
0.000000064 |
0.000021 |
0.00078 |
lowFe_KTKB_Day5 | 0.964000 | -0.0107 |
| Thaps_hclust_0240 |
 |
 |
0.000000064 |
0.000021 |
0.00078 |
BaP | 0.000370 | 1.69 |
| Thaps_hclust_0240 |
 |
 |
0.000000064 |
0.000021 |
0.00078 |
exponential_vs_stationary_24highlight | 0.434000 | -0.075 |
| Thaps_hclust_0240 |
 |
 |
0.000000064 |
0.000021 |
0.00078 |
co2_elevated_stat_arrays | 0.000658 | 0.716 |
| Thaps_hclust_0240 |
 |
 |
0.000000064 |
0.000021 |
0.00078 |
lowtemp_TMEVA | 0.000735 | 0.731 |
| Thaps_hclust_0240 |
 |
 |
0.000000064 |
0.000021 |
0.00078 |
highpH_TMEVA | 0.257000 | 0.158 |
| Thaps_hclust_0240 |
 |
 |
0.000000064 |
0.000021 |
0.00078 |
co2_elevated_expo_arrays | 0.985000 | 0.0085 |
| Thaps_hclust_0240 |
 |
 |
0.000000064 |
0.000021 |
0.00078 |
lowFe_TMEVA | 0.823000 | 0.0842 |
| Thaps_hclust_0240 |
 |
 |
0.000000064 |
0.000021 |
0.00078 |
exponential_vs_stationary_24light | 0.145000 | -0.395 |
| Thaps_hclust_0240 |
 |
 |
0.000000064 |
0.000021 |
0.00078 |
lowN_TMEVA | 0.130000 | 0.41 |
| Thaps_hclust_0240 |
 |
 |
0.000000064 |
0.000021 |
0.00078 |
diel_exponential_vs_stationary | 0.456000 | -0.127 |
| Thaps_hclust_0240 |
 |
 |
0.000000064 |
0.000021 |
0.00078 |
lowSi_TMEVA | 0.976000 | -0.122 |
| Thaps_hclust_0240 |
 |
 |
0.000000064 |
0.000021 |
0.00078 |
highlight_arrays | 0.088200 | 0.23 |
| Thaps_hclust_0240 |
 |
 |
0.000000064 |
0.000021 |
0.00078 |
diel_light_vs_dark | 0.626000 | 0.108 |
| Title | Cluster Plot | Dendrogram | e-value | e-value | e-value | Condition | Condition FDR | Condition Difference |
|---|---|---|---|---|---|---|---|---|
| Thaps_hclust_0239 |
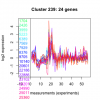 |
 |
0.000019 |
0.001 |
0.06 |
diel_light_vs_dark | 0.010700 | 0.453 |
| Thaps_hclust_0239 |
 |
 |
0.000019 |
0.001 |
0.06 |
lowFe_KTKB_Day3 | 0.535000 | -0.149 |
| Thaps_hclust_0239 |
 |
 |
0.000019 |
0.001 |
0.06 |
lowFe_KTKB_Day5 | 0.072400 | -0.323 |
| Thaps_hclust_0239 |
 |
 |
0.000019 |
0.001 |
0.06 |
BaP | 0.000370 | 1.47 |
| Thaps_hclust_0239 |
 |
 |
0.000019 |
0.001 |
0.06 |
exponential_vs_stationary_24highlight | 0.584000 | -0.0587 |
| Thaps_hclust_0239 |
 |
 |
0.000019 |
0.001 |
0.06 |
co2_elevated_stat_arrays | 0.381000 | 0.201 |
| Thaps_hclust_0239 |
 |
 |
0.000019 |
0.001 |
0.06 |
lowtemp_TMEVA | 0.025800 | 0.531 |
| Thaps_hclust_0239 |
 |
 |
0.000019 |
0.001 |
0.06 |
highpH_TMEVA | 0.334000 | 0.144 |
| Thaps_hclust_0239 |
 |
 |
0.000019 |
0.001 |
0.06 |
co2_elevated_expo_arrays | 1.000000 | -0.00239 |
| Thaps_hclust_0239 |
 |
 |
0.000019 |
0.001 |
0.06 |
lowFe_TMEVA | 0.432000 | 0.211 |
| Thaps_hclust_0239 |
 |
 |
0.000019 |
0.001 |
0.06 |
exponential_vs_stationary_24light | 0.900000 | 0.0468 |
| Thaps_hclust_0239 |
 |
 |
0.000019 |
0.001 |
0.06 |
lowN_TMEVA | 0.850000 | 0.0741 |
| Thaps_hclust_0239 |
 |
 |
0.000019 |
0.001 |
0.06 |
diel_exponential_vs_stationary | 0.956000 | -0.0155 |
| Thaps_hclust_0239 |
 |
 |
0.000019 |
0.001 |
0.06 |
lowSi_TMEVA | 1.000000 | 0.0651 |
| Thaps_hclust_0239 |
 |
 |
0.000019 |
0.001 |
0.06 |
highlight_arrays | 0.389000 | -0.133 |
| Title | Cluster Plot | Dendrogram | e-value | e-value | e-value | Condition | Condition FDR | Condition Difference |
|---|---|---|---|---|---|---|---|---|
| Thaps_hclust_0238 |
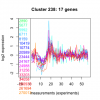 |
 |
0.0018 |
0.095 |
0.069 |
diel_light_vs_dark | 0.160000 | 0.314 |
| Thaps_hclust_0238 |
 |
 |
0.0018 |
0.095 |
0.069 |
lowFe_KTKB_Day3 | 0.926000 | -0.0324 |
| Thaps_hclust_0238 |
 |
 |
0.0018 |
0.095 |
0.069 |
lowFe_KTKB_Day5 | 0.138000 | 0.318 |
| Thaps_hclust_0238 |
 |
 |
0.0018 |
0.095 |
0.069 |
BaP | 0.000709 | 0.775 |
| Thaps_hclust_0238 |
 |
 |
0.0018 |
0.095 |
0.069 |
exponential_vs_stationary_24highlight | 0.375000 | 0.108 |
| Thaps_hclust_0238 |
 |
 |
0.0018 |
0.095 |
0.069 |
co2_elevated_stat_arrays | 0.867000 | 0.0493 |
| Thaps_hclust_0238 |
 |
 |
0.0018 |
0.095 |
0.069 |
lowtemp_TMEVA | 0.215000 | 0.348 |
| Thaps_hclust_0238 |
 |
 |
0.0018 |
0.095 |
0.069 |
highpH_TMEVA | 0.262000 | -0.192 |
| Thaps_hclust_0238 |
 |
 |
0.0018 |
0.095 |
0.069 |
co2_elevated_expo_arrays | 0.969000 | 0.0244 |
| Thaps_hclust_0238 |
 |
 |
0.0018 |
0.095 |
0.069 |
lowFe_TMEVA | 0.750000 | -0.12 |
| Thaps_hclust_0238 |
 |
 |
0.0018 |
0.095 |
0.069 |
exponential_vs_stationary_24light | 0.969000 | 0.0171 |
| Thaps_hclust_0238 |
 |
 |
0.0018 |
0.095 |
0.069 |
lowN_TMEVA | 0.661000 | -0.175 |
| Thaps_hclust_0238 |
 |
 |
0.0018 |
0.095 |
0.069 |
diel_exponential_vs_stationary | 0.649000 | -0.103 |
| Thaps_hclust_0238 |
 |
 |
0.0018 |
0.095 |
0.069 |
lowSi_TMEVA | 0.984000 | -0.106 |
| Thaps_hclust_0238 |
 |
 |
0.0018 |
0.095 |
0.069 |
highlight_arrays | 0.484000 | -0.13 |
| Title | Cluster Plot | Dendrogram | e-value | e-value | e-value | Condition | Condition FDR | Condition Difference |
|---|---|---|---|---|---|---|---|---|
| Thaps_hclust_0237 |
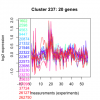 |
 |
0.0000097 |
0.000009 |
0.000056 |
diel_light_vs_dark | 0.952000 | 0.0245 |
| Thaps_hclust_0237 |
 |
 |
0.0000097 |
0.000009 |
0.000056 |
lowFe_KTKB_Day3 | 0.675000 | 0.115 |
| Thaps_hclust_0237 |
 |
 |
0.0000097 |
0.000009 |
0.000056 |
lowFe_KTKB_Day5 | 0.813000 | -0.0557 |
| Thaps_hclust_0237 |
 |
 |
0.0000097 |
0.000009 |
0.000056 |
BaP | 0.000709 | 0.689 |
| Thaps_hclust_0237 |
 |
 |
0.0000097 |
0.000009 |
0.000056 |
exponential_vs_stationary_24highlight | 0.939000 | 0.0123 |
| Thaps_hclust_0237 |
 |
 |
0.0000097 |
0.000009 |
0.000056 |
co2_elevated_stat_arrays | 0.801000 | -0.0715 |
| Thaps_hclust_0237 |
 |
 |
0.0000097 |
0.000009 |
0.000056 |
lowtemp_TMEVA | 0.475000 | 0.182 |
| Thaps_hclust_0237 |
 |
 |
0.0000097 |
0.000009 |
0.000056 |
highpH_TMEVA | 0.684000 | 0.0773 |
| Thaps_hclust_0237 |
 |
 |
0.0000097 |
0.000009 |
0.000056 |
co2_elevated_expo_arrays | 0.749000 | -0.0907 |
| Thaps_hclust_0237 |
 |
 |
0.0000097 |
0.000009 |
0.000056 |
lowFe_TMEVA | 0.316000 | -0.278 |
| Thaps_hclust_0237 |
 |
 |
0.0000097 |
0.000009 |
0.000056 |
exponential_vs_stationary_24light | 0.536000 | -0.221 |
| Thaps_hclust_0237 |
 |
 |
0.0000097 |
0.000009 |
0.000056 |
lowN_TMEVA | 0.842000 | 0.0794 |
| Thaps_hclust_0237 |
 |
 |
0.0000097 |
0.000009 |
0.000056 |
diel_exponential_vs_stationary | 0.663000 | -0.0923 |
| Thaps_hclust_0237 |
 |
 |
0.0000097 |
0.000009 |
0.000056 |
lowSi_TMEVA | 0.500000 | -0.403 |
| Thaps_hclust_0237 |
 |
 |
0.0000097 |
0.000009 |
0.000056 |
highlight_arrays | 0.675000 | 0.0751 |
| Title | Cluster Plot | Dendrogram | e-value | e-value | e-value | Condition | Condition FDR | Condition Difference |
|---|---|---|---|---|---|---|---|---|
| Thaps_hclust_0236 |
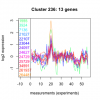 |
 |
0.0078 |
3.3 |
1.1 |
highlight_arrays | 0.073700 | -0.349 |
| Thaps_hclust_0236 |
 |
 |
0.0078 |
3.3 |
1.1 |
diel_light_vs_dark | 0.953000 | -0.0283 |
| Thaps_hclust_0236 |
 |
 |
0.0078 |
3.3 |
1.1 |
lowFe_KTKB_Day3 | 0.926000 | 0.0344 |
| Thaps_hclust_0236 |
 |
 |
0.0078 |
3.3 |
1.1 |
lowFe_KTKB_Day5 | 0.290000 | -0.266 |
| Thaps_hclust_0236 |
 |
 |
0.0078 |
3.3 |
1.1 |
BaP | 0.001910 | 0.84 |
| Thaps_hclust_0236 |
 |
 |
0.0078 |
3.3 |
1.1 |
exponential_vs_stationary_24highlight | 0.715000 | 0.0534 |
| Thaps_hclust_0236 |
 |
 |
0.0078 |
3.3 |
1.1 |
co2_elevated_stat_arrays | 0.311000 | -0.266 |
| Thaps_hclust_0236 |
 |
 |
0.0078 |
3.3 |
1.1 |
lowtemp_TMEVA | 0.929000 | 0.034 |
| Thaps_hclust_0236 |
 |
 |
0.0078 |
3.3 |
1.1 |
highpH_TMEVA | 0.943000 | 0.0237 |
| Thaps_hclust_0236 |
 |
 |
0.0078 |
3.3 |
1.1 |
co2_elevated_expo_arrays | 0.934000 | 0.0461 |
| Thaps_hclust_0236 |
 |
 |
0.0078 |
3.3 |
1.1 |
lowFe_TMEVA | 0.911000 | -0.0489 |
| Thaps_hclust_0236 |
 |
 |
0.0078 |
3.3 |
1.1 |
exponential_vs_stationary_24light | 0.900000 | 0.0578 |
| Thaps_hclust_0236 |
 |
 |
0.0078 |
3.3 |
1.1 |
lowN_TMEVA | 0.708000 | -0.158 |
| Thaps_hclust_0236 |
 |
 |
0.0078 |
3.3 |
1.1 |
diel_exponential_vs_stationary | 0.815000 | -0.0654 |
| Thaps_hclust_0236 |
 |
 |
0.0078 |
3.3 |
1.1 |
lowSi_TMEVA | 1.000000 | 0.0099 |
| Title | Cluster Plot | Dendrogram | e-value | e-value | e-value | Condition | Condition FDR | Condition Difference |
|---|---|---|---|---|---|---|---|---|
| Thaps_hclust_0235 |
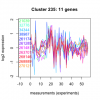 |
 |
0.47 |
5.6 |
74 |
lowSi_TMEVA | 0.613000 | -0.369 |
| Thaps_hclust_0235 |
 |
 |
0.47 |
5.6 |
74 |
highlight_arrays | 0.590000 | -0.123 |
| Thaps_hclust_0235 |
 |
 |
0.47 |
5.6 |
74 |
diel_light_vs_dark | 0.004510 | -0.789 |
| Thaps_hclust_0235 |
 |
 |
0.47 |
5.6 |
74 |
lowFe_KTKB_Day3 | 0.405000 | 0.278 |
| Thaps_hclust_0235 |
 |
 |
0.47 |
5.6 |
74 |
lowFe_KTKB_Day5 | 0.234000 | 0.322 |
| Thaps_hclust_0235 |
 |
 |
0.47 |
5.6 |
74 |
BaP | 0.004570 | 0.834 |
| Thaps_hclust_0235 |
 |
 |
0.47 |
5.6 |
74 |
exponential_vs_stationary_24highlight | 0.602000 | -0.0819 |
| Thaps_hclust_0235 |
 |
 |
0.47 |
5.6 |
74 |
co2_elevated_stat_arrays | 0.887000 | 0.0467 |
| Thaps_hclust_0235 |
 |
 |
0.47 |
5.6 |
74 |
lowtemp_TMEVA | 0.031000 | 0.771 |
| Thaps_hclust_0235 |
 |
 |
0.47 |
5.6 |
74 |
highpH_TMEVA | 0.150000 | 0.296 |
| Thaps_hclust_0235 |
 |
 |
0.47 |
5.6 |
74 |
co2_elevated_expo_arrays | 0.802000 | 0.0924 |
| Thaps_hclust_0235 |
 |
 |
0.47 |
5.6 |
74 |
lowFe_TMEVA | 0.549000 | -0.213 |
| Thaps_hclust_0235 |
 |
 |
0.47 |
5.6 |
74 |
exponential_vs_stationary_24light | 0.623000 | -0.222 |
| Thaps_hclust_0235 |
 |
 |
0.47 |
5.6 |
74 |
lowN_TMEVA | 0.761000 | -0.132 |
| Thaps_hclust_0235 |
 |
 |
0.47 |
5.6 |
74 |
diel_exponential_vs_stationary | 0.498000 | -0.171 |
| Title | Cluster Plot | Dendrogram | e-value | e-value | e-value | Condition | Condition FDR | Condition Difference |
|---|---|---|---|---|---|---|---|---|
| Thaps_hclust_0234 |
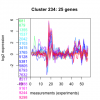 |
 |
0.036 |
0.063 |
0.24 |
diel_exponential_vs_stationary | 0.775000 | -0.0593 |
| Thaps_hclust_0234 |
 |
 |
0.036 |
0.063 |
0.24 |
lowSi_TMEVA | 0.195000 | 0.533 |
| Thaps_hclust_0234 |
 |
 |
0.036 |
0.063 |
0.24 |
highlight_arrays | 0.001240 | 0.461 |
| Thaps_hclust_0234 |
 |
 |
0.036 |
0.063 |
0.24 |
diel_light_vs_dark | 0.831000 | 0.0564 |
| Thaps_hclust_0234 |
 |
 |
0.036 |
0.063 |
0.24 |
lowFe_KTKB_Day3 | 0.000862 | -0.957 |
| Thaps_hclust_0234 |
 |
 |
0.036 |
0.063 |
0.24 |
lowFe_KTKB_Day5 | 0.001320 | -0.905 |
| Thaps_hclust_0234 |
 |
 |
0.036 |
0.063 |
0.24 |
BaP | 0.000370 | 1.89 |
| Thaps_hclust_0234 |
 |
 |
0.036 |
0.063 |
0.24 |
exponential_vs_stationary_24highlight | 0.364000 | -0.0895 |
| Thaps_hclust_0234 |
 |
 |
0.036 |
0.063 |
0.24 |
co2_elevated_stat_arrays | 0.000658 | 0.855 |
| Thaps_hclust_0234 |
 |
 |
0.036 |
0.063 |
0.24 |
lowtemp_TMEVA | 0.150000 | 0.329 |
