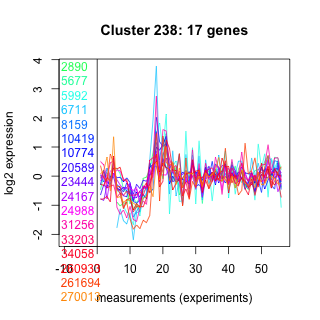
Thaps_hclust_0238 Hierarchical Clustering
Thalassiosira pseudonana
| GO ID | Go Term | p-value | q-value | Cluster |
|---|---|---|---|---|
| GO:0008616 | queuosine biosynthesis | 0.00495406 | 1 | Thaps_hclust_0238 |
| GO:0006400 | tRNA modification | 0.00495406 | 1 | Thaps_hclust_0238 |
| GO:0006979 | response to oxidative stress | 0.0294187 | 1 | Thaps_hclust_0238 |
| GO:0006306 | DNA methylation | 0.0354559 | 1 | Thaps_hclust_0238 |
| GO:0006260 | DNA replication | 0.0426592 | 1 | Thaps_hclust_0238 |
| GO:0008152 | metabolism | 0.410014 | 1 | Thaps_hclust_0238 |
|
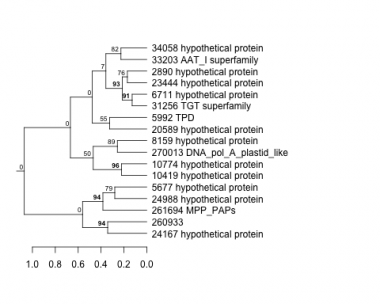
2890 : hypothetical protein |
10419 : hypothetical protein |
24167 : hypothetical protein |
34058 : hypothetical protein |
|
5677 : hypothetical protein |
10774 : hypothetical protein |
24988 : hypothetical protein |
260933 : |
|
5992 : TPD |
20589 : hypothetical protein |
31256 : TGT superfamily |
261694 : MPP_PAPs |
|
6711 : hypothetical protein |
23444 : hypothetical protein |
33203 : AAT_I superfamily |
270013 : DNA_pol_A_plastid_like |
|
8159 : hypothetical protein |
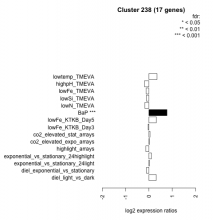
| Condition | Condition | Difference | FDR |
|---|---|---|---|
| diel_light_vs_dark | diel_light_vs_dark | 0.314 | 0.16 |
| lowFe_KTKB_Day3 | lowFe_KTKB_Day3 | -0.032 | 0.926 |
| lowFe_KTKB_Day5 | lowFe_KTKB_Day5 | 0.318 | 0.138 |
| BaP | BaP | 0.775 | 0.000709 |
| exponential_vs_stationary_24highlight | exponential_vs_stationary_24highlight | 0.108 | 0.375 |
| co2_elevated_stat_arrays | co2_elevated_stat_arrays | 0.049 | 0.867 |
| lowtemp_TMEVA | lowtemp_TMEVA | 0.348 | 0.215 |
| highpH_TMEVA | highpH_TMEVA | -0.192 | 0.262 |
| co2_elevated_expo_arrays | co2_elevated_expo_arrays | 0.024 | 0.969 |
| lowFe_TMEVA | lowFe_TMEVA | -0.120 | 0.75 |
| exponential_vs_stationary_24light | exponential_vs_stationary_24light | 0.017 | 0.969 |
| lowN_TMEVA | lowN_TMEVA | -0.175 | 0.661 |
| diel_exponential_vs_stationary | diel_exponential_vs_stationary | -0.103 | 0.649 |
| lowSi_TMEVA | lowSi_TMEVA | -0.106 | 0.984 |
| highlight_arrays | highlight_arrays | -0.130 | 0.484 |


