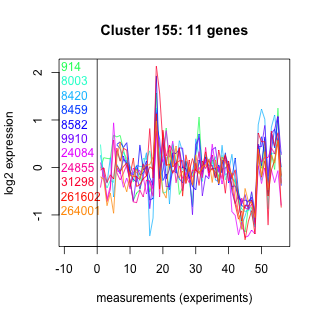
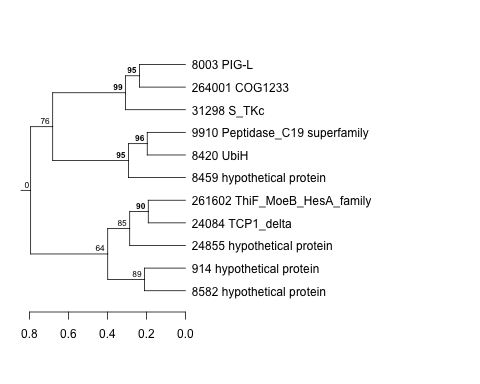
Thaps_hclust_0155 Hierarchical Clustering
Thalassiosira pseudonana
| Cluster Plot | Conditions Plot | Dendrogram |
|---|---|---|
 |
 |
 |
| GO ID | Go Term | p-value | q-value | Cluster |
|---|---|---|---|---|
| GO:0044267 | cellular protein metabolism | 0.0200978 | 1 | Thaps_hclust_0155 |
| GO:0006725 | aromatic compound metabolism | 0.031426 | 1 | Thaps_hclust_0155 |
| GO:0006118 | electron transport | 0.0526649 | 1 | Thaps_hclust_0155 |
| GO:0006511 | ubiquitin-dependent protein catabolism | 0.0715551 | 1 | Thaps_hclust_0155 |
| GO:0006468 | protein amino acid phosphorylation | 0.270534 | 1 | Thaps_hclust_0155 |
| GO:0008152 | metabolism | 0.459719 | 1 | Thaps_hclust_0155 |
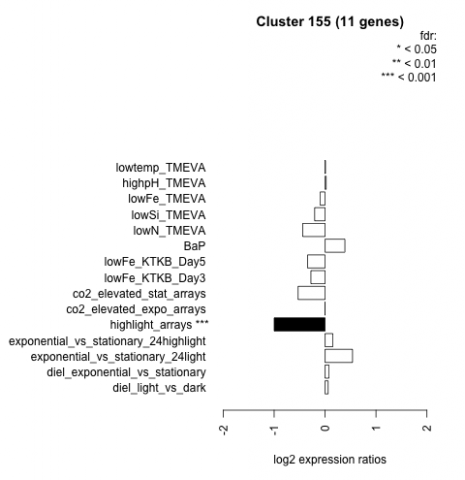
| Condition | Condition | Difference | FDR |
|---|---|---|---|
| diel_light_vs_dark | diel_light_vs_dark | 0.060 | 0.882 |
| lowFe_KTKB_Day3 | lowFe_KTKB_Day3 | -0.278 | 0.405 |
| lowFe_KTKB_Day5 | lowFe_KTKB_Day5 | -0.343 | 0.204 |
| BaP | BaP | 0.390 | 0.181 |
| exponential_vs_stationary_24highlight | exponential_vs_stationary_24highlight | 0.152 | 0.3 |
| co2_elevated_stat_arrays | co2_elevated_stat_arrays | -0.530 | 0.0522 |
| lowtemp_TMEVA | lowtemp_TMEVA | 0.008 | 0.992 |
| highpH_TMEVA | highpH_TMEVA | 0.021 | 0.962 |
| co2_elevated_expo_arrays | co2_elevated_expo_arrays | 0.000 | 1 |
| lowFe_TMEVA | lowFe_TMEVA | -0.098 | 0.823 |
| exponential_vs_stationary_24light | exponential_vs_stationary_24light | 0.539 | 0.178 |
| lowN_TMEVA | lowN_TMEVA | -0.439 | 0.293 |
| diel_exponential_vs_stationary | diel_exponential_vs_stationary | 0.077 | 0.783 |
| lowSi_TMEVA | lowSi_TMEVA | -0.205 | 0.854 |
| highlight_arrays | highlight_arrays | -0.999 | 0.000442 |