Hierarchical Clusters
Displaying 1501 - 1600 of 7500
| Title | Cluster Plot | Dendrogram | e-value | e-value | e-value | Condition | Condition FDR | Condition Difference |
|---|---|---|---|---|---|---|---|---|
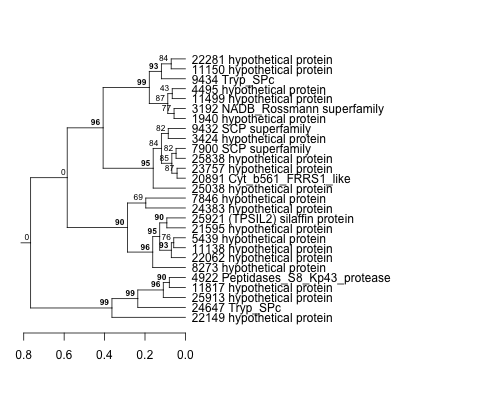
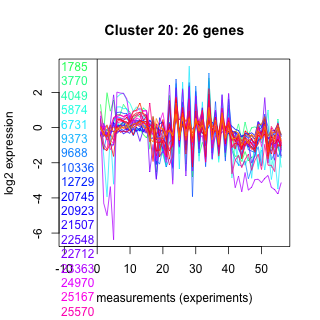
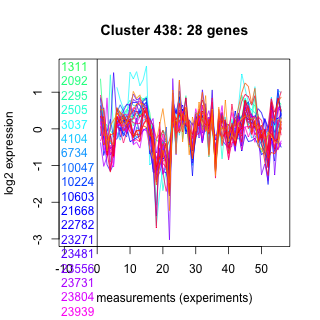
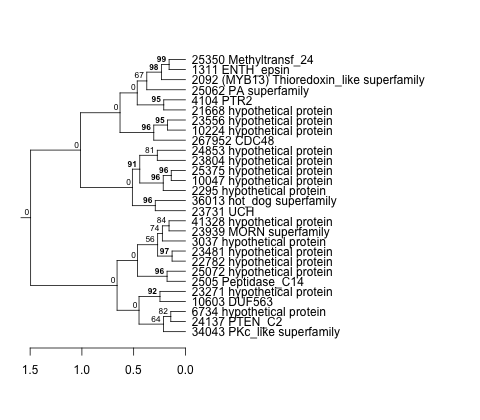
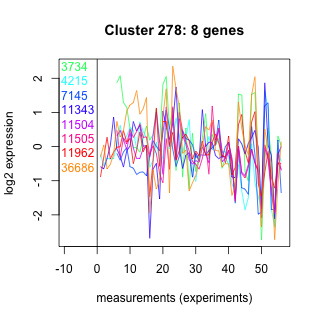
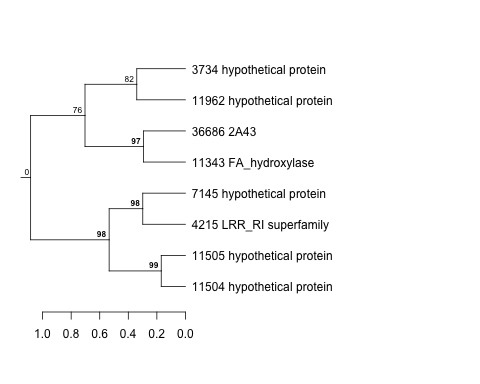
| Thaps_hclust_0214 |
 |
 |
0.00006 |
0.0000000031 |
0.00076 |
exponential_vs_stationary_24highlight | 0.009570 | 0.157 |
| Title | Cluster Plot | Dendrogram | e-value | e-value | e-value | Condition | Condition FDR | Condition Difference |
|---|---|---|---|---|---|---|---|---|
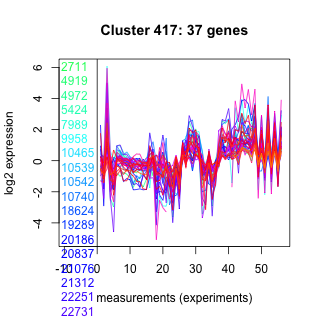
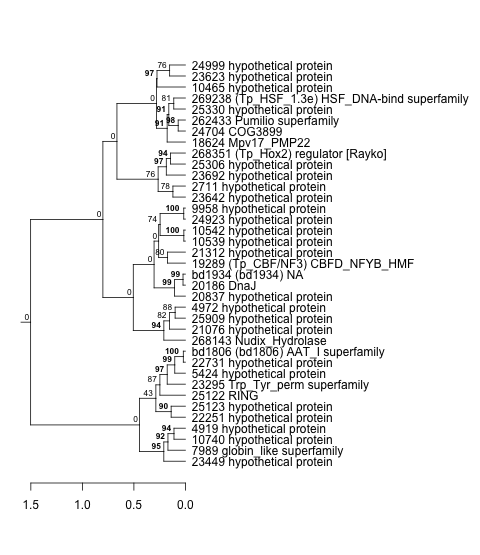
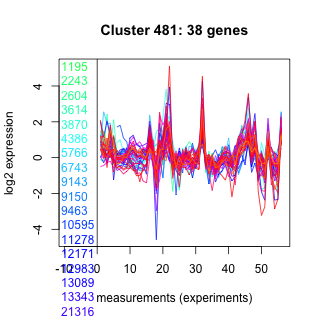
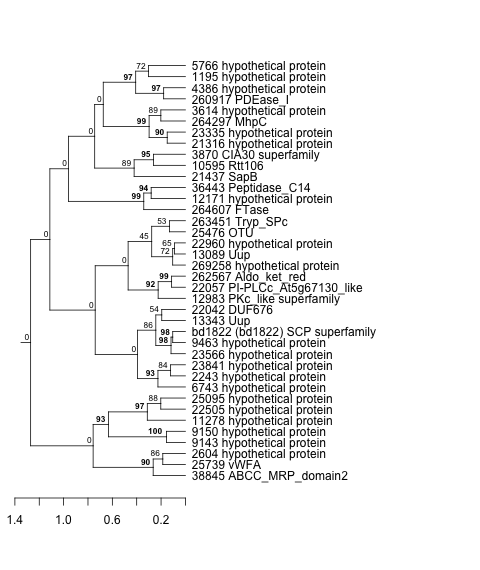
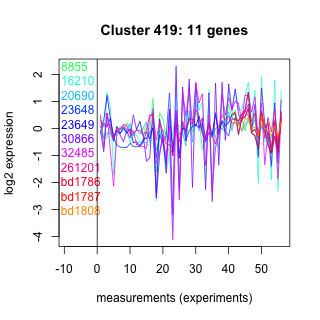
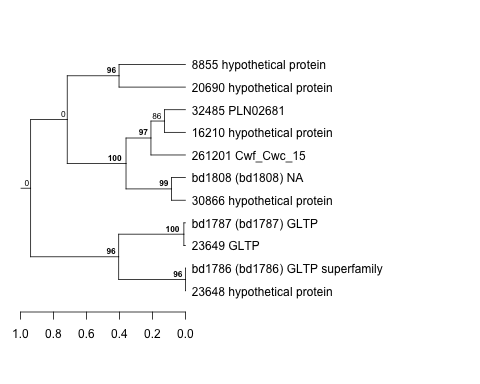
| Thaps_hclust_0417 |
 |
 |
0.0000000018 |
0.00013 |
0.00029 |
lowSi_TMEVA | 0.009620 | -0.718 |
| Title | Cluster Plot | Dendrogram | e-value | e-value | e-value | Condition | Condition FDR | Condition Difference |
|---|---|---|---|---|---|---|---|---|
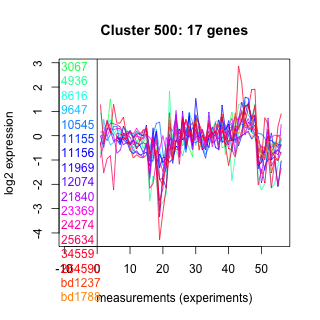
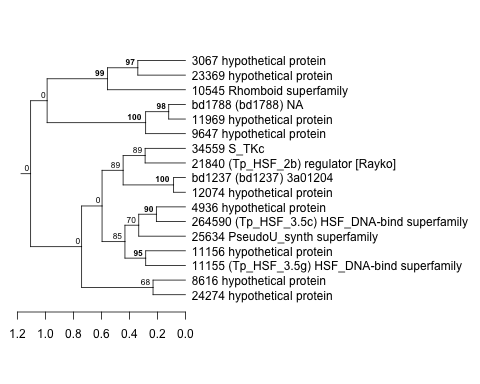
| Thaps_hclust_0496 |
 |
 |
0.00082 |
0.0031 |
0.43 |
diel_light_vs_dark | 0.009630 | -0.447 |
| Title | Cluster Plot | Dendrogram | e-value | e-value | e-value | Condition | Condition FDR | Condition Difference |
|---|---|---|---|---|---|---|---|---|
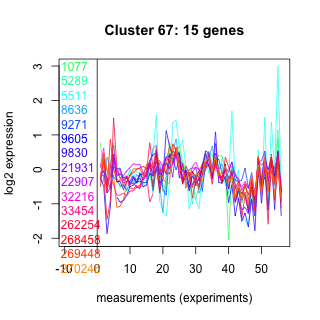
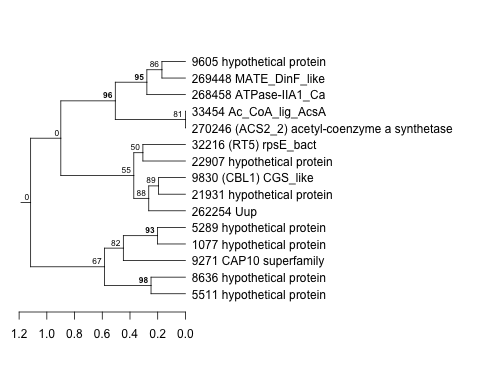
| Thaps_hclust_0067 |
 |
 |
0.0036 |
0.86 |
0.11 |
exponential_vs_stationary_24light | 0.009720 | 0.882 |
| Title | Cluster Plot | Dendrogram | e-value | e-value | e-value | Condition | Condition FDR | Condition Difference |
|---|---|---|---|---|---|---|---|---|
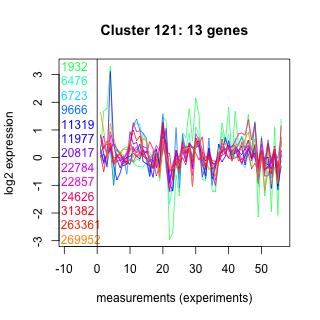
| Thaps_hclust_0121 |
 |
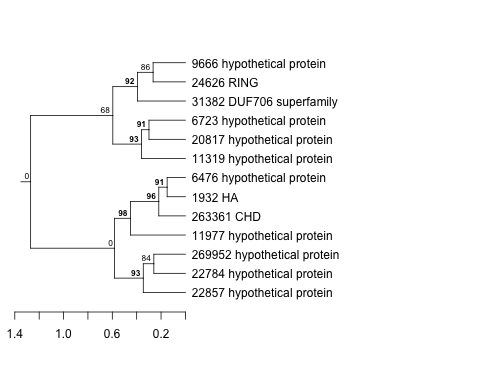 |
0.00021 |
0.77 |
30 |
highlight_arrays | 0.009800 | 0.498 |
| Title | Cluster Plot | Dendrogram | e-value | e-value | e-value | Condition | Condition FDR | Condition Difference |
|---|---|---|---|---|---|---|---|---|
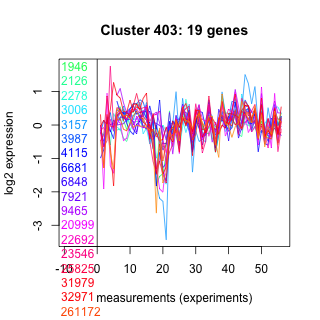
| Thaps_hclust_0403 |
 |
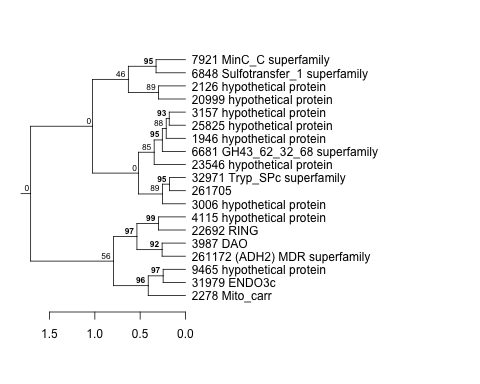 |
0.83 |
0.015 |
0.016 |
lowFe_TMEVA | 0.009840 | -0.614 |
| Title | Cluster Plot | Dendrogram | e-value | e-value | e-value | Condition | Condition FDR | Condition Difference |
|---|---|---|---|---|---|---|---|---|
| Thaps_hclust_0041 |
 |
 |
4.4e-38 |
0.000000011 |
0.0000042 |
exponential_vs_stationary_24highlight | 0.009860 | 0.158 |
| Title | Cluster Plot | Dendrogram | e-value | e-value | e-value | Condition | Condition FDR | Condition Difference |
|---|---|---|---|---|---|---|---|---|
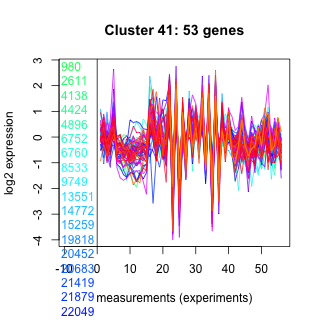
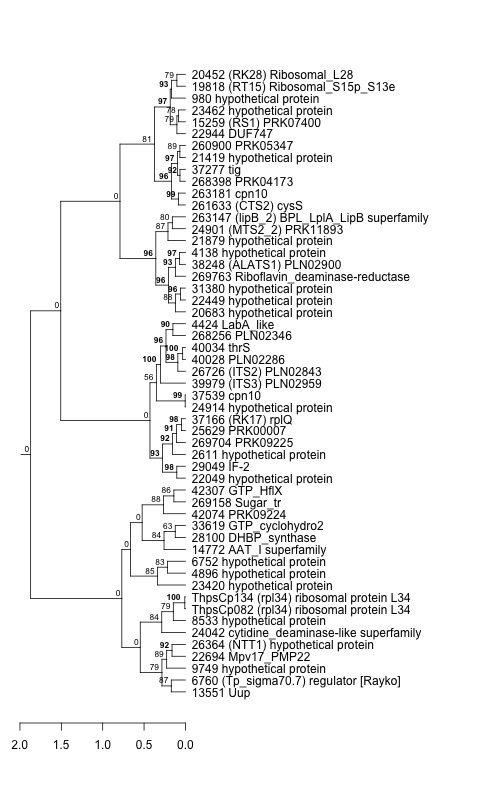
| Thaps_hclust_0186 |
 |
 |
0.0000000043 |
0.006 |
0.0000084 |
co2_elevated_stat_arrays | 0.009910 | -0.499 |
| Title | Cluster Plot | Dendrogram | e-value | e-value | e-value | Condition | Condition FDR | Condition Difference |
|---|---|---|---|---|---|---|---|---|
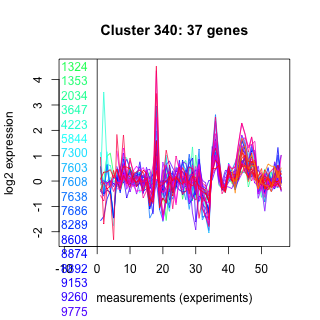
| Thaps_hclust_0340 |
 |
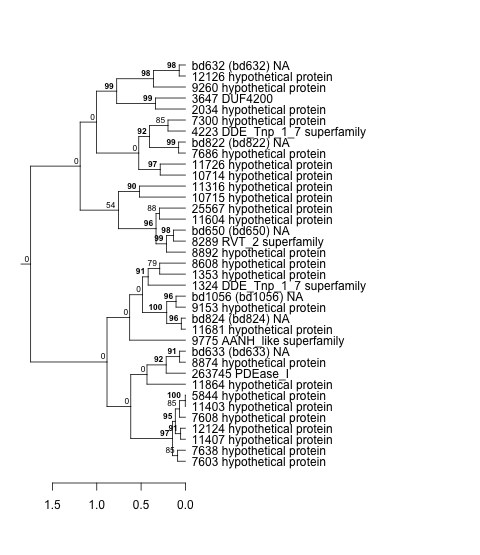 |
0.00000000039 |
0.0000000031 |
0.0000002 |
lowFe_KTKB_Day3 | 0.010000 | -0.403 |
| Title | Cluster Plot | Dendrogram | e-value | e-value | e-value | Condition | Condition FDR | Condition Difference |
|---|---|---|---|---|---|---|---|---|
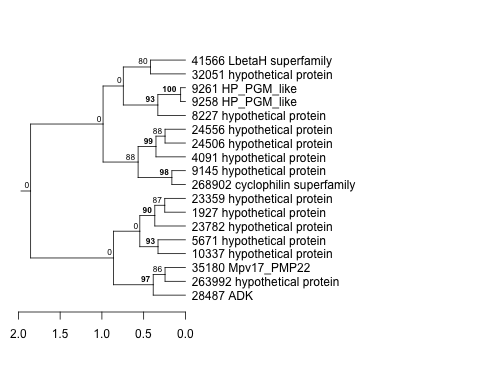
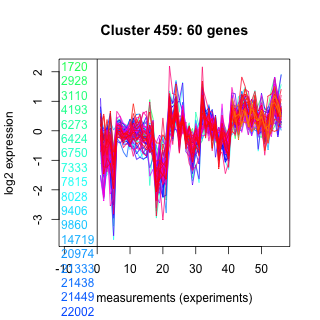
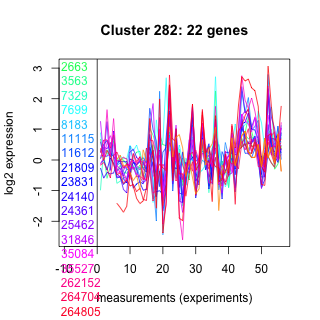
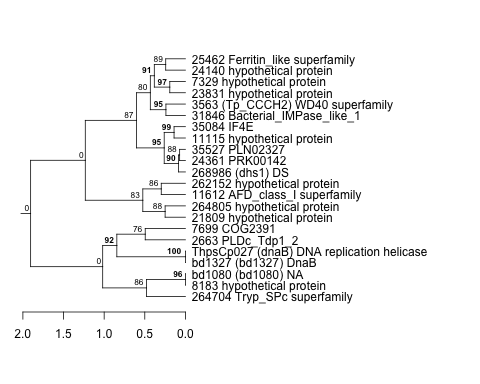
| Thaps_hclust_0333 |
 |
 |
0.00062 |
4 |
17 |
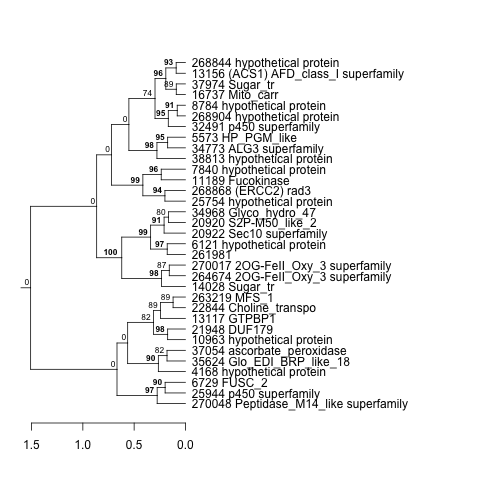
diel_exponential_vs_stationary | 0.010000 | -0.376 |
| Thaps_hclust_0333 |
|
|
0.00062 |
4 |
17 |
diel_light_vs_dark | 0.012500 | -0.437 |
| Thaps_hclust_0333 |
|
|
0.00062 |
4 |
17 |
exponential_vs_stationary_24light | 0.013500 | -0.667 |
| Title | Cluster Plot | Dendrogram | e-value | e-value | e-value | Condition | Condition FDR | Condition Difference |
|---|---|---|---|---|---|---|---|---|
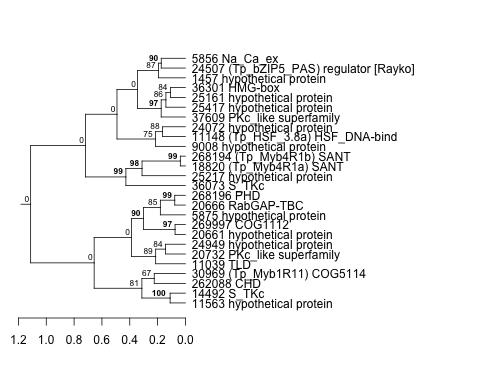
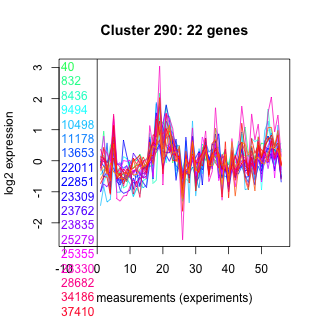
| Thaps_hclust_0290 |
 |
 |
3e-16 |
0.014 |
0.072 |
lowtemp_TMEVA | 0.010000 | 0.658 |
| Title | Cluster Plot | Dendrogram | e-value | e-value | e-value | Condition | Condition FDR | Condition Difference |
|---|---|---|---|---|---|---|---|---|
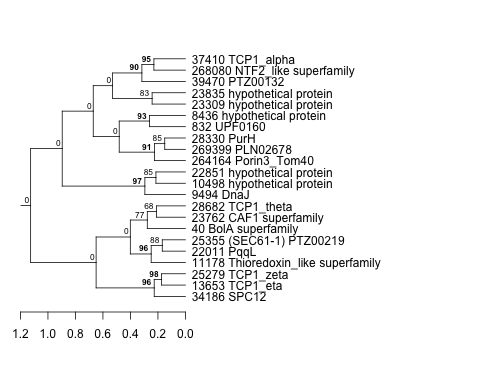
| Thaps_hclust_0321 |
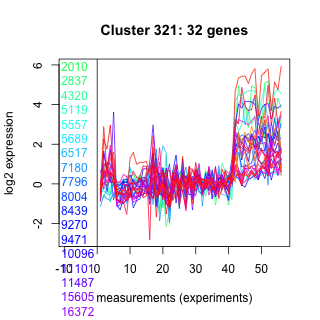 |
 |
0.000000086 |
0.0000000042 |
0.0000028 |
exponential_vs_stationary_24highlight | 0.010100 | -0.196 |
| Thaps_hclust_0321 |
|
|
0.000000086 |
0.0000000042 |
0.0000028 |
lowtemp_TMEVA | 0.013200 | 0.521 |
| Title | Cluster Plot | Dendrogram | e-value | e-value | e-value | Condition | Condition FDR | Condition Difference |
|---|---|---|---|---|---|---|---|---|
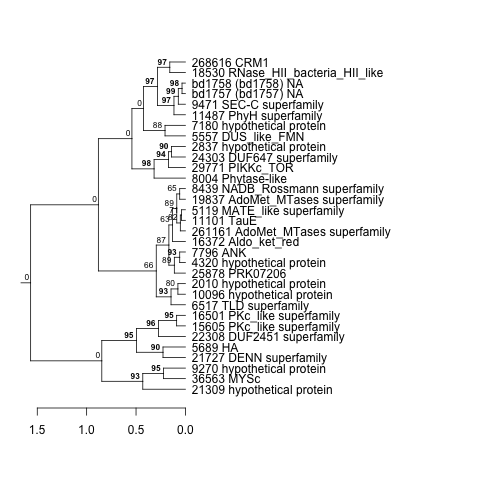
| Thaps_hclust_0469 |
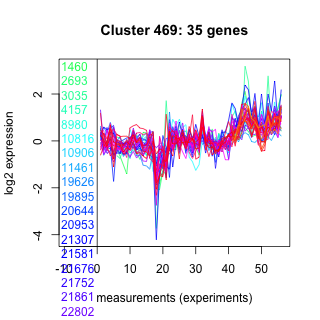 |
 |
0.000013 |
0.00011 |
0.00029 |
lowFe_KTKB_Day5 | 0.010200 | -0.353 |
| Title | Cluster Plot | Dendrogram | e-value | e-value | e-value | Condition | Condition FDR | Condition Difference |
|---|---|---|---|---|---|---|---|---|
| Thaps_hclust_0021 |
 |
 |
0.00000000002 |
0.0000088 |
0.0012 |
diel_exponential_vs_stationary | 0.010200 | 0.317 |
| Thaps_hclust_0021 |
|
|
0.00000000002 |
0.0000088 |
0.0012 |
co2_elevated_expo_arrays | 0.012300 | 0.244 |
| Title | Cluster Plot | Dendrogram | e-value | e-value | e-value | Condition | Condition FDR | Condition Difference |
|---|---|---|---|---|---|---|---|---|
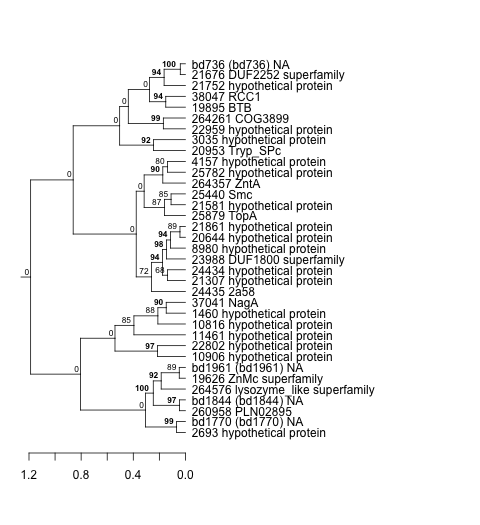
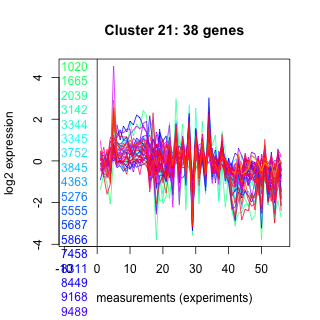
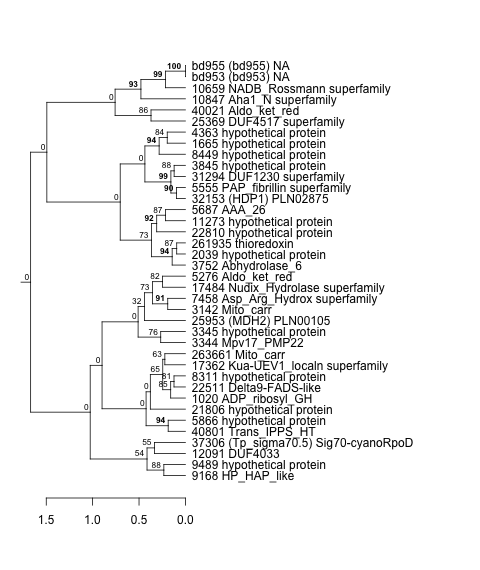
| Thaps_hclust_0414 |
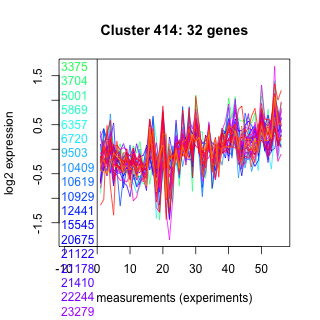 |
 |
0.0000000000028 |
0.00000026 |
0.000019 |
diel_exponential_vs_stationary | 0.010200 | -0.339 |
| Title | Cluster Plot | Dendrogram | e-value | e-value | e-value | Condition | Condition FDR | Condition Difference |
|---|---|---|---|---|---|---|---|---|
| Thaps_hclust_0255 |
 |
 |
1.4e-28 |
0.0000000000000024 |
0.000000029 |
diel_exponential_vs_stationary | 0.010200 | 0.533 |
| Title | Cluster Plot | Dendrogram | e-value | e-value | e-value | Condition | Condition FDR | Condition Difference |
|---|---|---|---|---|---|---|---|---|
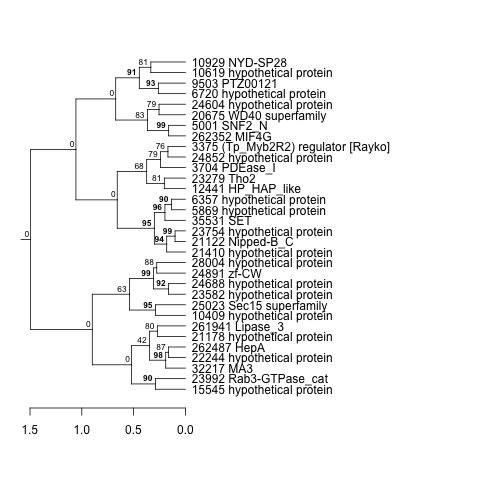
| Thaps_hclust_0396 |
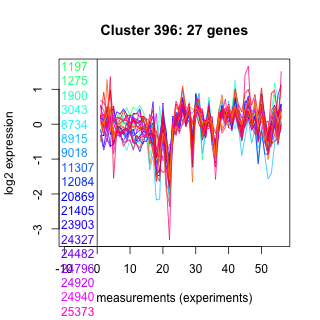 |
 |
0.082 |
10 |
29 |
co2_elevated_stat_arrays | 0.010300 | -0.439 |
| Title | Cluster Plot | Dendrogram | e-value | e-value | e-value | Condition | Condition FDR | Condition Difference |
|---|---|---|---|---|---|---|---|---|
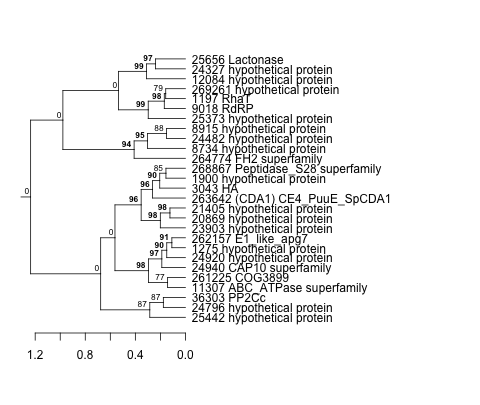
| Thaps_hclust_0316 |
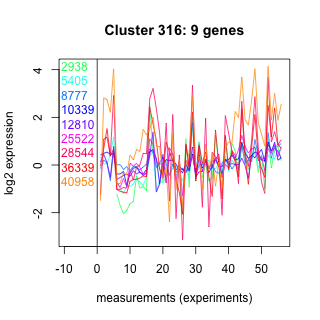 |
 |
0.14 |
2.2 |
4.4 |
exponential_vs_stationary_24highlight | 0.010400 | -0.401 |
| Title | Cluster Plot | Dendrogram | e-value | e-value | e-value | Condition | Condition FDR | Condition Difference |
|---|---|---|---|---|---|---|---|---|
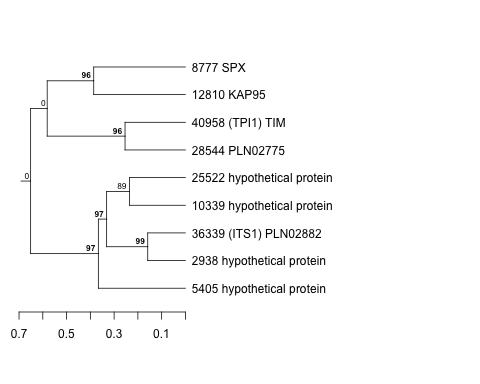
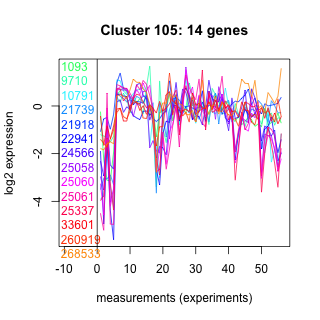
| Thaps_hclust_0105 |
 |
 |
49 |
0.074 |
21 |
highlight_arrays | 0.010400 | 0.481 |
| Title | Cluster Plot | Dendrogram | e-value | e-value | e-value | Condition | Condition FDR | Condition Difference |
|---|---|---|---|---|---|---|---|---|
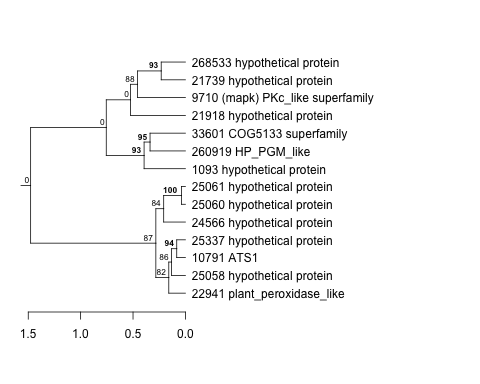
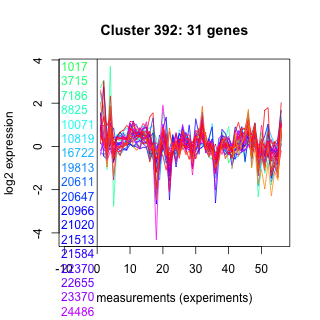
| Thaps_hclust_0392 |
 |
 |
0.00055 |
0.0027 |
0.19 |
lowSi_TMEVA | 0.010400 | 0.778 |
| Title | Cluster Plot | Dendrogram | e-value | e-value | e-value | Condition | Condition FDR | Condition Difference |
|---|---|---|---|---|---|---|---|---|
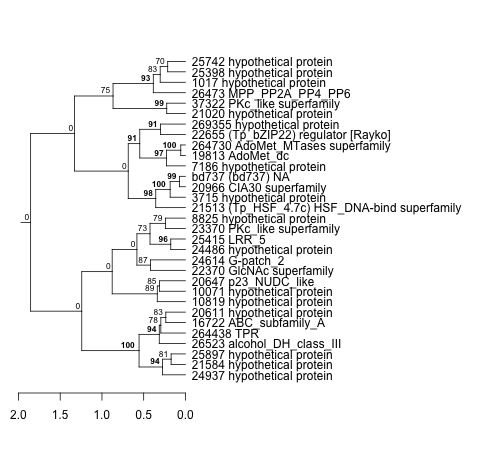
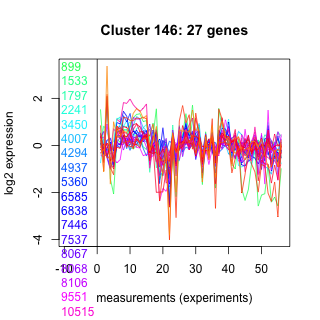
| Thaps_hclust_0146 |
 |
 |
0.00000000081 |
0.000016 |
0.0025 |
BaP | 0.010500 | -0.455 |
| Title | Cluster Plot | Dendrogram | e-value | e-value | e-value | Condition | Condition FDR | Condition Difference |
|---|---|---|---|---|---|---|---|---|
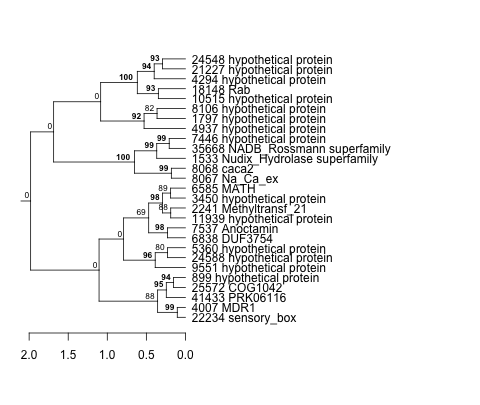
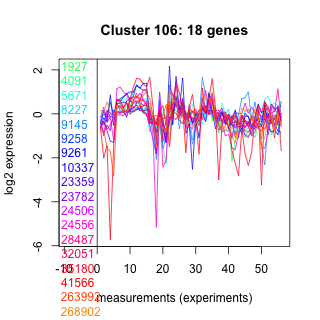
| Thaps_hclust_0106 |
 |
 |
0.48 |
3.7 |
8.9 |
highpH_TMEVA | 0.010500 | -0.445 |
| Title | Cluster Plot | Dendrogram | e-value | e-value | e-value | Condition | Condition FDR | Condition Difference |
|---|---|---|---|---|---|---|---|---|
| Thaps_hclust_0459 |
 |
 |
0.00000000015 |
0.0000000056 |
0.000000015 |
lowFe_KTKB_Day3 | 0.010500 | -0.299 |
| Title | Cluster Plot | Dendrogram | e-value | e-value | e-value | Condition | Condition FDR | Condition Difference |
|---|---|---|---|---|---|---|---|---|
| Thaps_hclust_0090 |
 |
 |
0.23 |
2.7 |
11 |
diel_exponential_vs_stationary | 0.010500 | 0.541 |
| Title | Cluster Plot | Dendrogram | e-value | e-value | e-value | Condition | Condition FDR | Condition Difference |
|---|---|---|---|---|---|---|---|---|
| Thaps_hclust_0144 |
 |
 |
0.000000001 |
0.0000000019 |
0.00000019 |
highpH_TMEVA | 0.010500 | 0.277 |
| Title | Cluster Plot | Dendrogram | e-value | e-value | e-value | Condition | Condition FDR | Condition Difference |
|---|---|---|---|---|---|---|---|---|
| Thaps_hclust_0135 |
 |
 |
0.0000000028 |
0.0077 |
0.17 |
exponential_vs_stationary_24highlight | 0.010600 | 0.198 |
| Title | Cluster Plot | Dendrogram | e-value | e-value | e-value | Condition | Condition FDR | Condition Difference |
|---|---|---|---|---|---|---|---|---|
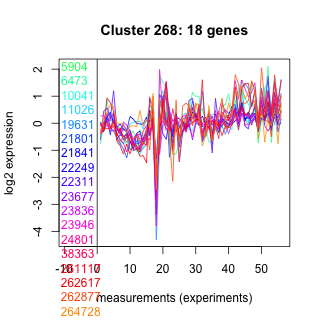
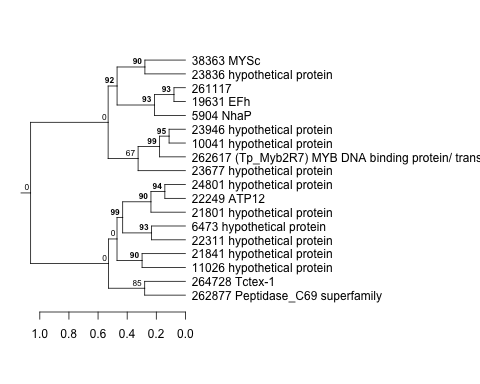
| Thaps_hclust_0268 |
 |
 |
0.17 |
14 |
60 |
exponential_vs_stationary_24highlight | 0.010600 | -0.287 |
| Title | Cluster Plot | Dendrogram | e-value | e-value | e-value | Condition | Condition FDR | Condition Difference |
|---|---|---|---|---|---|---|---|---|
| Thaps_hclust_0239 |
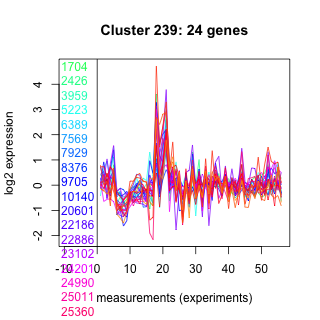 |
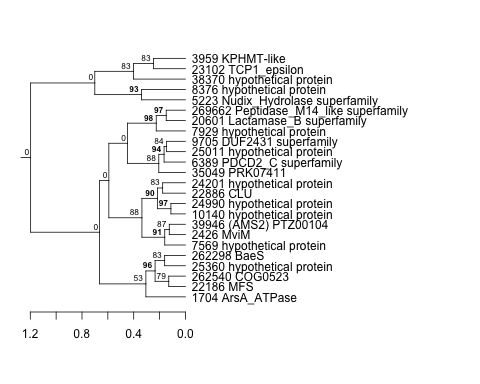 |
0.000019 |
0.001 |
0.06 |
diel_light_vs_dark | 0.010700 | 0.453 |
| Title | Cluster Plot | Dendrogram | e-value | e-value | e-value | Condition | Condition FDR | Condition Difference |
|---|---|---|---|---|---|---|---|---|
| Thaps_hclust_0441 |
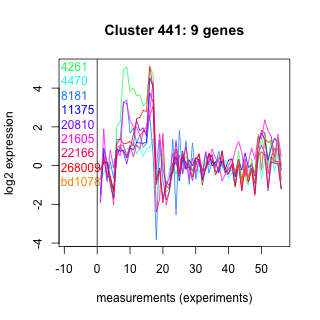 |
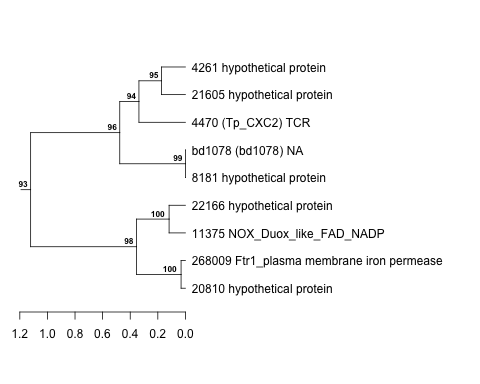 |
0.00081 |
0.001 |
0.0015 |
lowtemp_TMEVA | 0.010800 | -1.07 |
| Title | Cluster Plot | Dendrogram | e-value | e-value | e-value | Condition | Condition FDR | Condition Difference |
|---|---|---|---|---|---|---|---|---|
| Thaps_hclust_0036 |
 |
 |
0.0000003 |
0.00016 |
110 |
lowtemp_TMEVA | 0.010800 | -0.505 |
| Title | Cluster Plot | Dendrogram | e-value | e-value | e-value | Condition | Condition FDR | Condition Difference |
|---|---|---|---|---|---|---|---|---|
| Thaps_hclust_0440 |
 |
 |
0.68 |
4.6 |
250 |
diel_exponential_vs_stationary | 0.010800 | 0.531 |
| Title | Cluster Plot | Dendrogram | e-value | e-value | e-value | Condition | Condition FDR | Condition Difference |
|---|---|---|---|---|---|---|---|---|
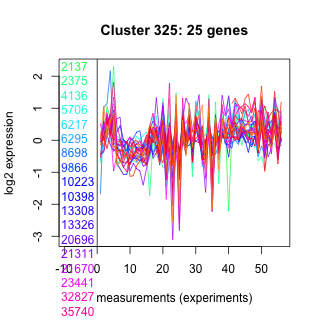
| Thaps_hclust_0325 |
 |
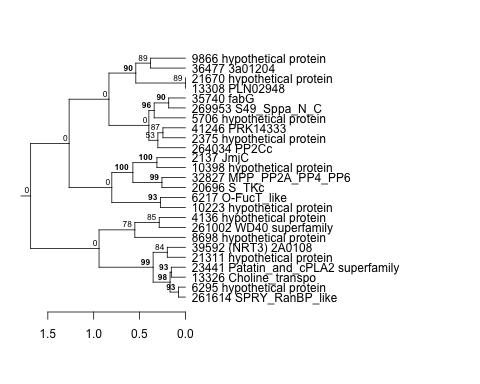 |
0.00000000000002 |
0.000000076 |
0.17 |
lowtemp_TMEVA | 0.010800 | 0.575 |
| Title | Cluster Plot | Dendrogram | e-value | e-value | e-value | Condition | Condition FDR | Condition Difference |
|---|---|---|---|---|---|---|---|---|
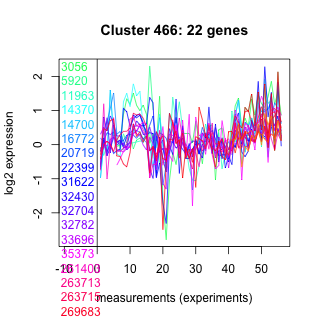
| Thaps_hclust_0466 |
 |
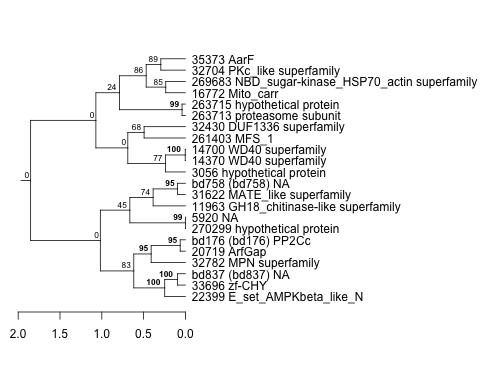 |
0.0000055 |
0.000014 |
0.0017 |
highpH_TMEVA | 0.010800 | -0.394 |
| Title | Cluster Plot | Dendrogram | e-value | e-value | e-value | Condition | Condition FDR | Condition Difference |
|---|---|---|---|---|---|---|---|---|
| Thaps_hclust_0399 |
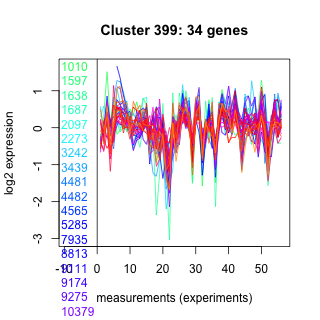 |
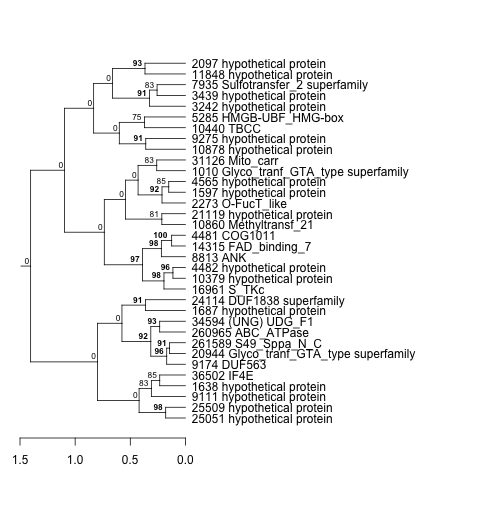 |
0.0039 |
0.16 |
0.0016 |
BaP | 0.010900 | -0.404 |
| Title | Cluster Plot | Dendrogram | e-value | e-value | e-value | Condition | Condition FDR | Condition Difference |
|---|---|---|---|---|---|---|---|---|
| Thaps_hclust_0498 |
 |
 |
1.3 |
1.8 |
1.8 |
lowSi_TMEVA | 0.010900 | -1.01 |
| Title | Cluster Plot | Dendrogram | e-value | e-value | e-value | Condition | Condition FDR | Condition Difference |
|---|---|---|---|---|---|---|---|---|
| Thaps_hclust_0493 |
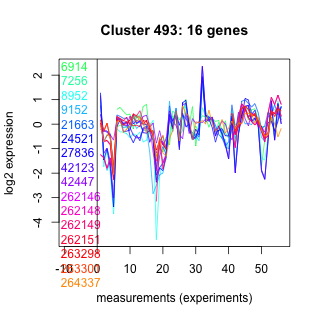 |
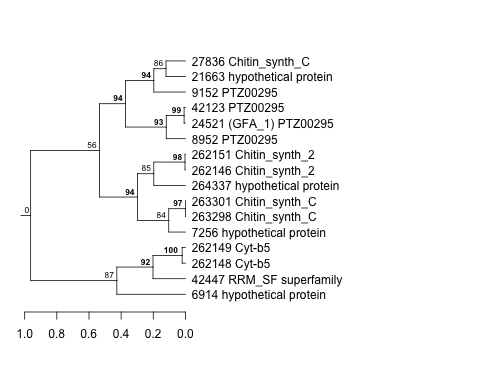 |
0.00000036 |
0.0000009 |
0.000056 |
lowSi_TMEVA | 0.010900 | -1.02 |
| Thaps_hclust_0493 |
|
|
0.00000036 |
0.0000009 |
0.000056 |
co2_elevated_expo_arrays | 0.012300 | -0.356 |
| Title | Cluster Plot | Dendrogram | e-value | e-value | e-value | Condition | Condition FDR | Condition Difference |
|---|---|---|---|---|---|---|---|---|
| Thaps_hclust_0462 |
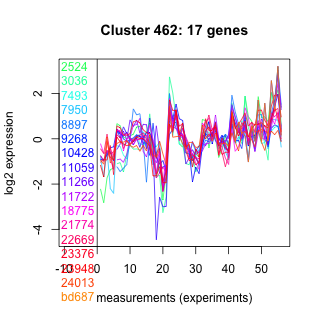 |
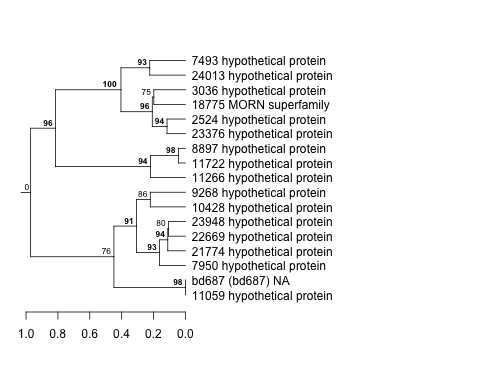 |
0.0000000094 |
0.0000011 |
0.000046 |
highlight_arrays | 0.011000 | -0.43 |
| Title | Cluster Plot | Dendrogram | e-value | e-value | e-value | Condition | Condition FDR | Condition Difference |
|---|---|---|---|---|---|---|---|---|
| Thaps_hclust_0277 |
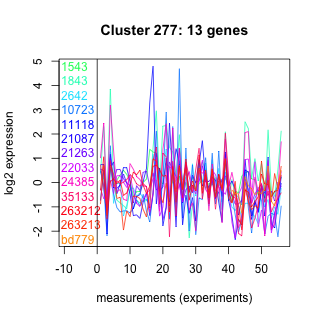 |
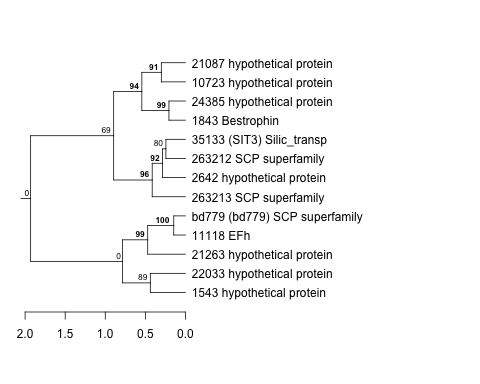 |
0.00036 |
6.6 |
7.6 |
co2_elevated_expo_arrays | 0.011000 | -0.406 |
| Title | Cluster Plot | Dendrogram | e-value | e-value | e-value | Condition | Condition FDR | Condition Difference |
|---|---|---|---|---|---|---|---|---|
| Thaps_hclust_0044 |
 |
 |
0.27 |
2.6 |
4.2 |
BaP | 0.011100 | -0.709 |
| Title | Cluster Plot | Dendrogram | e-value | e-value | e-value | Condition | Condition FDR | Condition Difference |
|---|---|---|---|---|---|---|---|---|
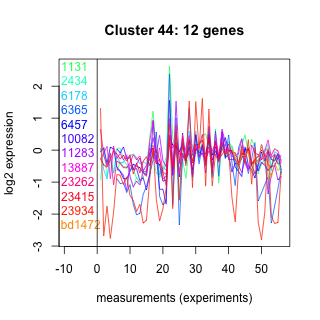
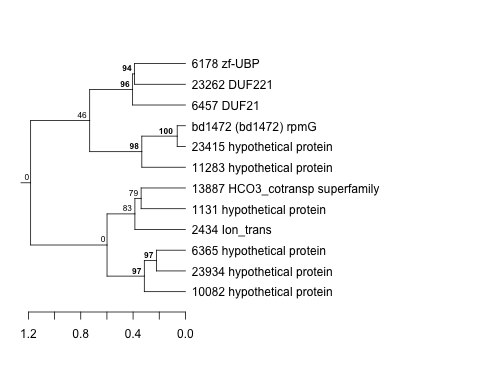
| Thaps_hclust_0271 |
 |
 |
Not available | Not available | Not available | highpH_TMEVA | 0.011100 | -0.277 |
| Thaps_hclust_0271 |
|
|
Not available | Not available | Not available | exponential_vs_stationary_24light | 0.012300 | -0.538 |
| Title | Cluster Plot | Dendrogram | e-value | e-value | e-value | Condition | Condition FDR | Condition Difference |
|---|---|---|---|---|---|---|---|---|
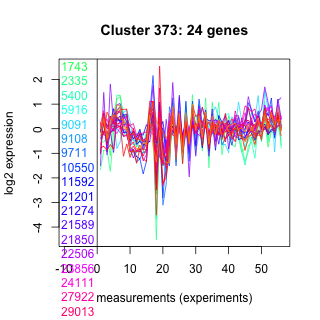
| Thaps_hclust_0373 |
 |
 |
0.00017 |
0.001 |
0.066 |
highpH_TMEVA | 0.011100 | -0.373 |
| Title | Cluster Plot | Dendrogram | e-value | e-value | e-value | Condition | Condition FDR | Condition Difference |
|---|---|---|---|---|---|---|---|---|
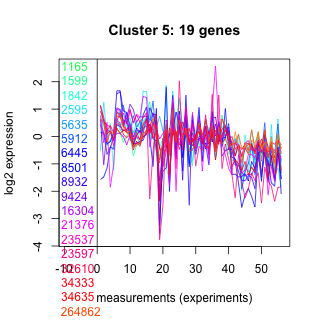
| Thaps_hclust_0005 |
 |
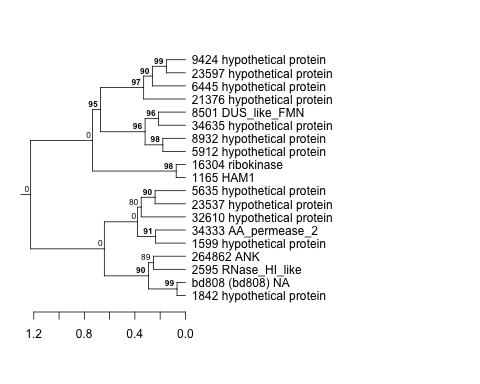 |
0.00013 |
0.0027 |
2 |
exponential_vs_stationary_24highlight | 0.011200 | 0.268 |
| Title | Cluster Plot | Dendrogram | e-value | e-value | e-value | Condition | Condition FDR | Condition Difference |
|---|---|---|---|---|---|---|---|---|
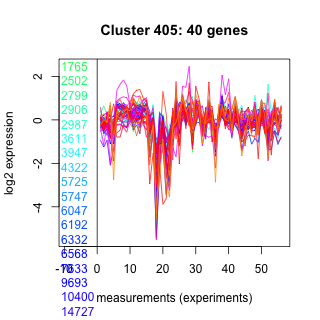
| Thaps_hclust_0405 |
 |
 |
0.00000000036 |
0.0000000063 |
0.005 |
co2_elevated_stat_arrays | 0.011200 | -0.386 |
| Title | Cluster Plot | Dendrogram | e-value | e-value | e-value | Condition | Condition FDR | Condition Difference |
|---|---|---|---|---|---|---|---|---|
| Thaps_hclust_0366 |
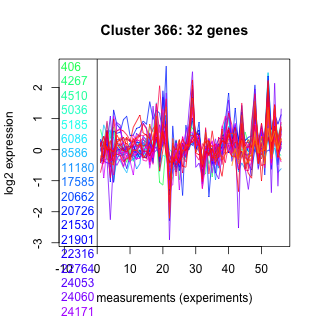 |
 |
0.000011 |
0.054 |
0.47 |
co2_elevated_stat_arrays | 0.011200 | 0.431 |
| Title | Cluster Plot | Dendrogram | e-value | e-value | e-value | Condition | Condition FDR | Condition Difference |
|---|---|---|---|---|---|---|---|---|
| Thaps_hclust_0260 |
 |
 |
1.6e-36 |
9.1e-22 |
8.6e-22 |
co2_elevated_stat_arrays | 0.011200 | 0.673 |
| Title | Cluster Plot | Dendrogram | e-value | e-value | e-value | Condition | Condition FDR | Condition Difference |
|---|---|---|---|---|---|---|---|---|
| Thaps_hclust_0291 |
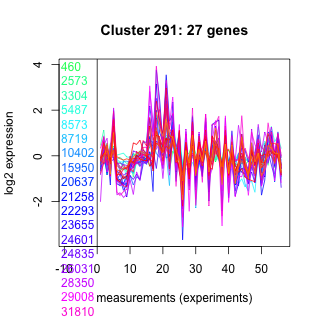 |
 |
0.000000049 |
0.000056 |
0.0000035 |
co2_elevated_stat_arrays | 0.011200 | 0.437 |
| Title | Cluster Plot | Dendrogram | e-value | e-value | e-value | Condition | Condition FDR | Condition Difference |
|---|---|---|---|---|---|---|---|---|
| Thaps_hclust_0336 |
 |
 |
8.7e-23 |
0.00000000000015 |
0.0000000000000032 |
diel_light_vs_dark | 0.011200 | -0.688 |
| Title | Cluster Plot | Dendrogram | e-value | e-value | e-value | Condition | Condition FDR | Condition Difference |
|---|---|---|---|---|---|---|---|---|
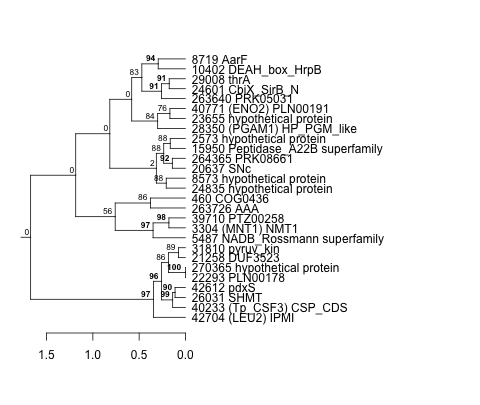
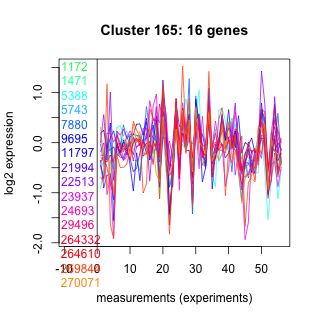
| Thaps_hclust_0165 |
 |
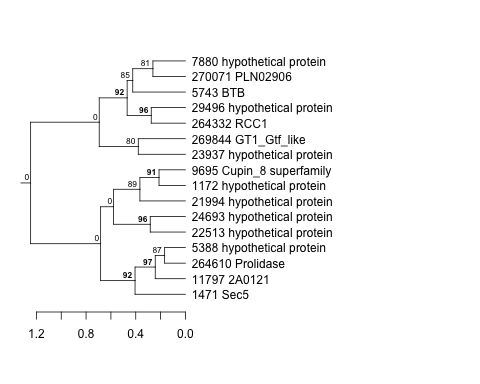 |
0.00011 |
2.3 |
3.9 |
lowtemp_TMEVA | 0.011200 | -0.777 |
| Title | Cluster Plot | Dendrogram | e-value | e-value | e-value | Condition | Condition FDR | Condition Difference |
|---|---|---|---|---|---|---|---|---|
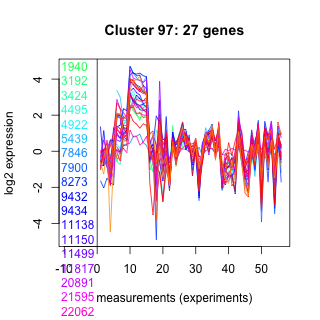
| Thaps_hclust_0097 |
 |
 |
0.02 |
1.4 |
3.4 |
diel_light_vs_dark | 0.011200 | 0.423 |
| Title | Cluster Plot | Dendrogram | e-value | e-value | e-value | Condition | Condition FDR | Condition Difference |
|---|---|---|---|---|---|---|---|---|
| Thaps_hclust_0329 |
 |
 |
0.0000000004 |
0.00000034 |
0.000023 |
highpH_TMEVA | 0.011400 | 0.3 |
| Title | Cluster Plot | Dendrogram | e-value | e-value | e-value | Condition | Condition FDR | Condition Difference |
|---|---|---|---|---|---|---|---|---|
| Thaps_hclust_0020 |
 |
 |
0.004 |
0.15 |
3.3 |
lowN_TMEVA | 0.011400 | -0.698 |
| Title | Cluster Plot | Dendrogram | e-value | e-value | e-value | Condition | Condition FDR | Condition Difference |
|---|---|---|---|---|---|---|---|---|
| Thaps_hclust_0048 |
 |
 |
4.8e-17 |
0.000000018 |
0.0000097 |
lowN_TMEVA | 0.011400 | -0.651 |
| Thaps_hclust_0048 |
|
|
4.8e-17 |
0.000000018 |
0.0000097 |
lowSi_TMEVA | 0.012900 | -0.745 |
| Title | Cluster Plot | Dendrogram | e-value | e-value | e-value | Condition | Condition FDR | Condition Difference |
|---|---|---|---|---|---|---|---|---|
| Thaps_hclust_0086 |
 |
 |
0.0000000068 |
0.01 |
0.0037 |
lowN_TMEVA | 0.011400 | -0.647 |
| Title | Cluster Plot | Dendrogram | e-value | e-value | e-value | Condition | Condition FDR | Condition Difference |
|---|---|---|---|---|---|---|---|---|
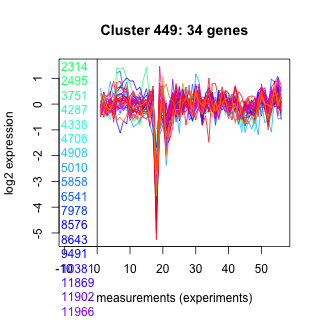
| Thaps_hclust_0449 |
 |
 |
0.0000000011 |
0.012 |
3.5 |
highlight_arrays | 0.011500 | -0.301 |
| Title | Cluster Plot | Dendrogram | e-value | e-value | e-value | Condition | Condition FDR | Condition Difference |
|---|---|---|---|---|---|---|---|---|
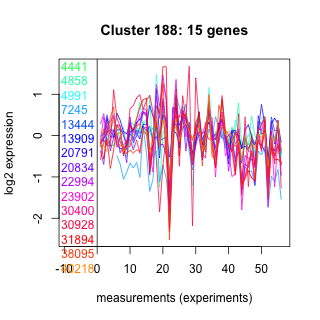
| Thaps_hclust_0188 |
 |
 |
0.0058 |
0.31 |
0.34 |
co2_elevated_stat_arrays | 0.011500 | -0.562 |
| Title | Cluster Plot | Dendrogram | e-value | e-value | e-value | Condition | Condition FDR | Condition Difference |
|---|---|---|---|---|---|---|---|---|
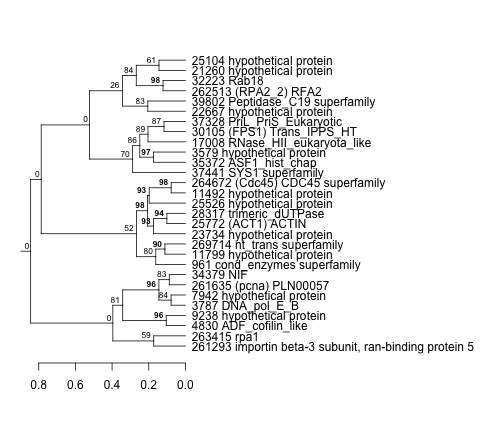
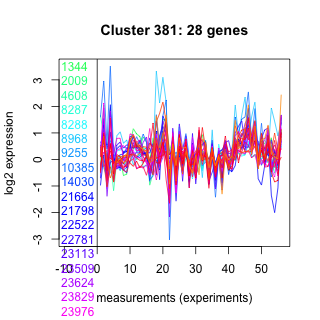
| Thaps_hclust_0381 |
 |
 |
0.0001 |
0.0035 |
0.061 |
lowSi_TMEVA | 0.011600 | 0.797 |
| Title | Cluster Plot | Dendrogram | e-value | e-value | e-value | Condition | Condition FDR | Condition Difference |
|---|---|---|---|---|---|---|---|---|
| Thaps_hclust_0331 |
 |
 |
0.000000000011 |
20 |
1600 |
co2_elevated_expo_arrays | 0.011800 | 0.258 |
| Thaps_hclust_0331 |
|
|
0.000000000011 |
20 |
1600 |
diel_exponential_vs_stationary | 0.012400 | -0.331 |
| Thaps_hclust_0331 |
|
|
0.000000000011 |
20 |
1600 |
diel_light_vs_dark | 0.012500 | -0.378 |
| Title | Cluster Plot | Dendrogram | e-value | e-value | e-value | Condition | Condition FDR | Condition Difference |
|---|---|---|---|---|---|---|---|---|
| Thaps_hclust_0205 |
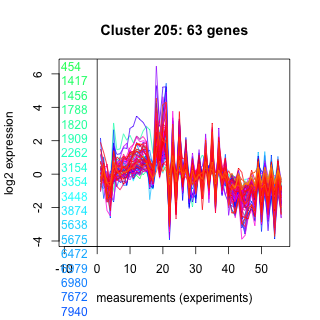 |
 |
2.3e-23 |
7.6e-16 |
0.00000015 |
lowtemp_TMEVA | 0.012000 | 0.371 |
| Title | Cluster Plot | Dendrogram | e-value | e-value | e-value | Condition | Condition FDR | Condition Difference |
|---|---|---|---|---|---|---|---|---|
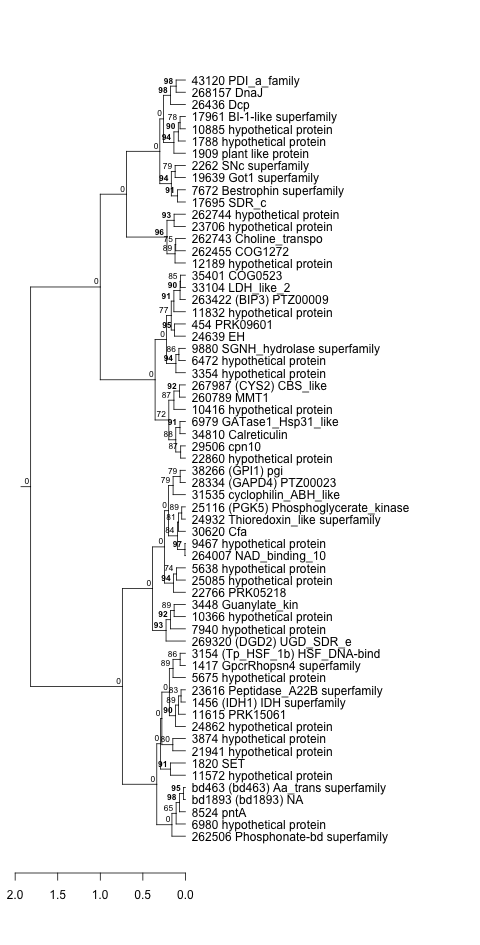
| Thaps_hclust_0295 |
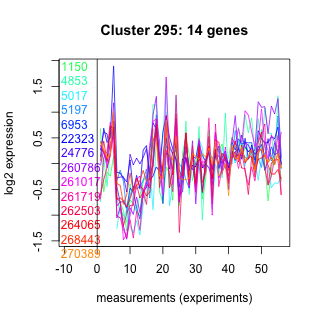 |
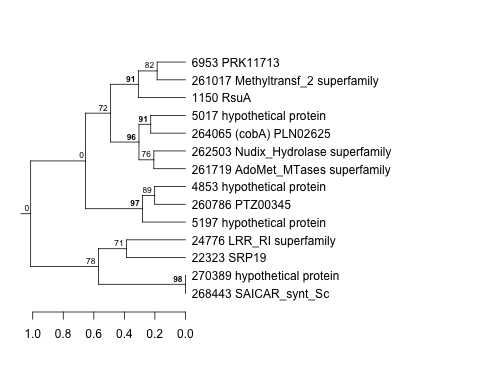 |
0.0000053 |
0.00095 |
0.0005 |
lowtemp_TMEVA | 0.012000 | 0.803 |
| Title | Cluster Plot | Dendrogram | e-value | e-value | e-value | Condition | Condition FDR | Condition Difference |
|---|---|---|---|---|---|---|---|---|
| Thaps_hclust_0015 |
 |
|
2.5e-25 |
7.4e-21 |
0.0000000011 |
lowtemp_TMEVA | 0.012000 | 0.362 |
| Title | Cluster Plot | Dendrogram | e-value | e-value | e-value | Condition | Condition FDR | Condition Difference |
|---|---|---|---|---|---|---|---|---|
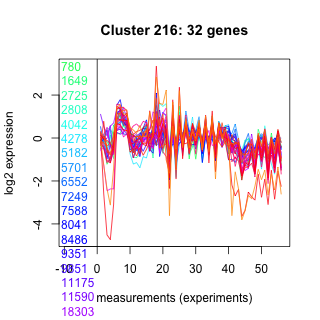
| Thaps_hclust_0216 |
 |
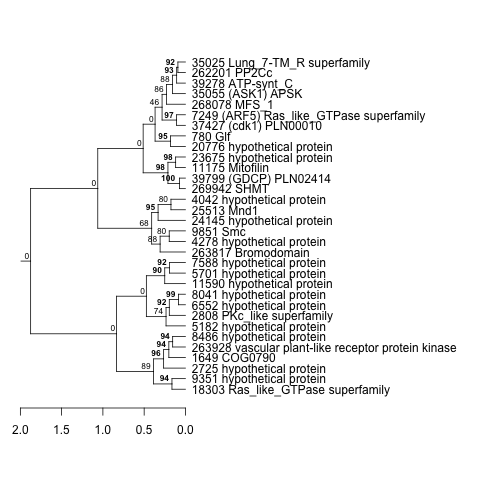 |
0.0000076 |
0.019 |
0.0036 |
diel_exponential_vs_stationary | 0.012100 | -0.332 |
| Title | Cluster Plot | Dendrogram | e-value | e-value | e-value | Condition | Condition FDR | Condition Difference |
|---|---|---|---|---|---|---|---|---|
| Thaps_hclust_0011 |
 |
 |
0.000023 |
10 |
1.3 |
BaP | 0.012100 | 0.56 |
| Title | Cluster Plot | Dendrogram | e-value | e-value | e-value | Condition | Condition FDR | Condition Difference |
|---|---|---|---|---|---|---|---|---|
| Thaps_hclust_0076 |
 |
 |
0.0047 |
0.13 |
1.2 |
diel_exponential_vs_stationary | 0.012100 | -0.4 |
| Title | Cluster Plot | Dendrogram | e-value | e-value | e-value | Condition | Condition FDR | Condition Difference |
|---|---|---|---|---|---|---|---|---|
| Thaps_hclust_0075 |
 |
 |
0.069 |
53 |
33 |
highpH_TMEVA | 0.012200 | -0.516 |
| Title | Cluster Plot | Dendrogram | e-value | e-value | e-value | Condition | Condition FDR | Condition Difference |
|---|---|---|---|---|---|---|---|---|
| Thaps_hclust_0364 |
 |
 |
4.5 |
28 |
590 |
exponential_vs_stationary_24highlight | 0.012200 | -0.361 |
| Title | Cluster Plot | Dendrogram | e-value | e-value | e-value | Condition | Condition FDR | Condition Difference |
|---|---|---|---|---|---|---|---|---|
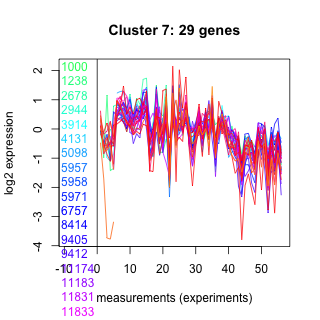
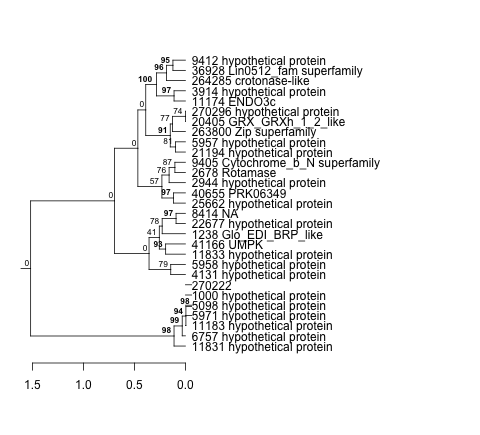
| Thaps_hclust_0500 |
 |
 |
0.91 |
14 |
30 |
lowFe_KTKB_Day5 | 0.012300 | -0.527 |
| Title | Cluster Plot | Dendrogram | e-value | e-value | e-value | Condition | Condition FDR | Condition Difference |
|---|---|---|---|---|---|---|---|---|
| Thaps_hclust_0007 |
 |
 |
0.0000000001 |
0.0000000097 |
0.000027 |
lowFe_KTKB_Day5 | 0.012300 | -0.393 |
| Title | Cluster Plot | Dendrogram | e-value | e-value | e-value | Condition | Condition FDR | Condition Difference |
|---|---|---|---|---|---|---|---|---|
| Thaps_hclust_0324 |
 |
 |
0.0023 |
2.4 |
5.1 |
exponential_vs_stationary_24light | 0.012300 | -0.796 |
| Title | Cluster Plot | Dendrogram | e-value | e-value | e-value | Condition | Condition FDR | Condition Difference |
|---|---|---|---|---|---|---|---|---|
| Thaps_hclust_0362 |
 |
 |
0.00003 |
0.0033 |
0.66 |
lowSi_TMEVA | 0.012300 | -0.944 |
| Title | Cluster Plot | Dendrogram | e-value | e-value | e-value | Condition | Condition FDR | Condition Difference |
|---|---|---|---|---|---|---|---|---|
| Thaps_hclust_0096 |
 |
 |
0.0000028 |
0.9 |
0.38 |
co2_elevated_stat_arrays | 0.012600 | 0.434 |
| Title | Cluster Plot | Dendrogram | e-value | e-value | e-value | Condition | Condition FDR | Condition Difference |
|---|---|---|---|---|---|---|---|---|
| Thaps_hclust_0388 |
 |
 |
0.0000000024 |
23 |
380 |
diel_exponential_vs_stationary | 0.012600 | 0.475 |
| Title | Cluster Plot | Dendrogram | e-value | e-value | e-value | Condition | Condition FDR | Condition Difference |
|---|---|---|---|---|---|---|---|---|
| Thaps_hclust_0368 |
 |
 |
0.0078 |
2.5 |
3.1 |
diel_exponential_vs_stationary | 0.012600 | -0.617 |
| Title | Cluster Plot | Dendrogram | e-value | e-value | e-value | Condition | Condition FDR | Condition Difference |
|---|---|---|---|---|---|---|---|---|
| Thaps_hclust_0091 |
 |
 |
0.00000061 |
0.00022 |
0.44 |
diel_light_vs_dark | 0.012700 | 0.524 |
| Title | Cluster Plot | Dendrogram | e-value | e-value | e-value | Condition | Condition FDR | Condition Difference |
|---|---|---|---|---|---|---|---|---|
| Thaps_hclust_0160 |
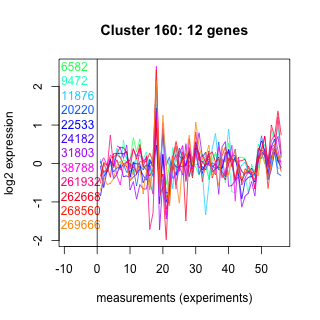 |
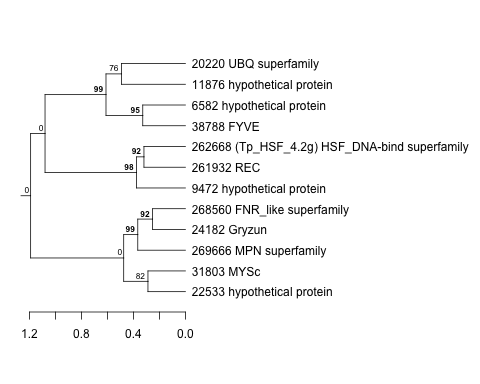 |
0.35 |
66 |
160 |
highlight_arrays | 0.012700 | -0.474 |
| Title | Cluster Plot | Dendrogram | e-value | e-value | e-value | Condition | Condition FDR | Condition Difference |
|---|---|---|---|---|---|---|---|---|
| Thaps_hclust_0438 |
 |
 |
0.0024 |
1.5 |
3.6 |
diel_light_vs_dark | 0.012700 | 0.399 |
| Title | Cluster Plot | Dendrogram | e-value | e-value | e-value | Condition | Condition FDR | Condition Difference |
|---|---|---|---|---|---|---|---|---|
| Thaps_hclust_0468 |
 |
 |
0.0023 |
0.08 |
2.3 |
exponential_vs_stationary_24highlight | 0.012800 | -0.211 |
| Title | Cluster Plot | Dendrogram | e-value | e-value | e-value | Condition | Condition FDR | Condition Difference |
|---|---|---|---|---|---|---|---|---|
| Thaps_hclust_0030 |
 |
 |
0.000056 |
0.048 |
0.088 |
lowN_TMEVA | 0.012900 | -0.739 |
| Title | Cluster Plot | Dendrogram | e-value | e-value | e-value | Condition | Condition FDR | Condition Difference |
|---|---|---|---|---|---|---|---|---|
| Thaps_hclust_0278 |
 |
 |
0.093 |
0.57 |
39 |
lowFe_KTKB_Day3 | 0.013000 | -0.916 |
| Title | Cluster Plot | Dendrogram | e-value | e-value | e-value | Condition | Condition FDR | Condition Difference |
|---|---|---|---|---|---|---|---|---|
| Thaps_hclust_0481 |
 |
 |
0.000000069 |
0.00000053 |
0.000012 |
BaP | 0.013100 | 0.377 |
| Title | Cluster Plot | Dendrogram | e-value | e-value | e-value | Condition | Condition FDR | Condition Difference |
|---|---|---|---|---|---|---|---|---|
| Thaps_hclust_0419 |
 |
 |
0.0014 |
0.00031 |
0.0014 |
BaP | 0.013200 | -0.723 |
| Thaps_hclust_0419 |
|
|
0.0014 |
0.00031 |
0.0014 |
diel_exponential_vs_stationary | 0.013500 | -0.613 |
| Title | Cluster Plot | Dendrogram | e-value | e-value | e-value | Condition | Condition FDR | Condition Difference |
|---|---|---|---|---|---|---|---|---|
| Thaps_hclust_0166 |
 |
 |
0.001 |
5.3 |
63 |
BaP | 0.013200 | 0.725 |
| Title | Cluster Plot | Dendrogram | e-value | e-value | e-value | Condition | Condition FDR | Condition Difference |
|---|---|---|---|---|---|---|---|---|
| Thaps_hclust_0282 |
 |
 |
0.0005 |
0.0059 |
0.15 |
diel_exponential_vs_stationary | 0.013200 | 0.39 |
| Title | Cluster Plot | Dendrogram | e-value | e-value | e-value | Condition | Condition FDR | Condition Difference |
|---|---|---|---|---|---|---|---|---|
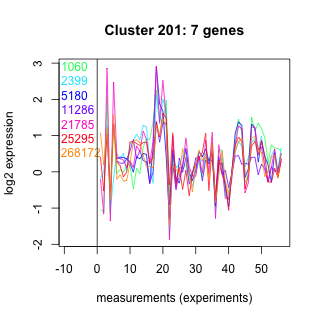
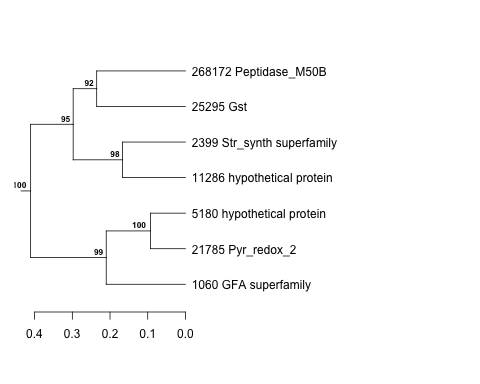
| Thaps_hclust_0201 |
 |
 |
0.11 |
7.6 |
12 |
lowtemp_TMEVA | 0.013200 | 1.31 |
| Title | Cluster Plot | Dendrogram | e-value | e-value | e-value | Condition | Condition FDR | Condition Difference |
|---|---|---|---|---|---|---|---|---|
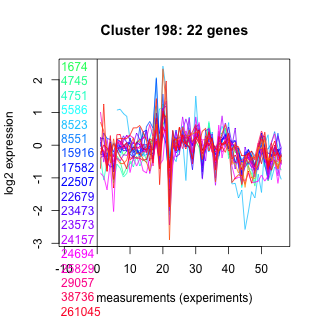
| Thaps_hclust_0198 |
 |
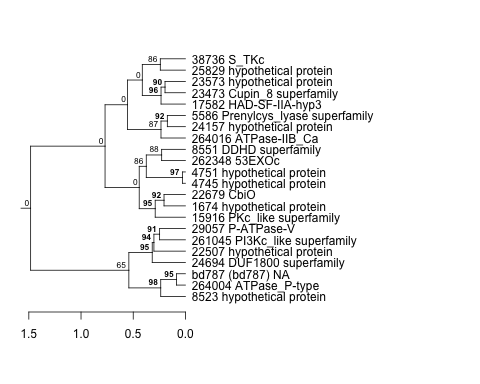 |
0.00091 |
0.017 |
0.0046 |
lowtemp_TMEVA | 0.013200 | -0.636 |
| Title | Cluster Plot | Dendrogram | e-value | e-value | e-value | Condition | Condition FDR | Condition Difference |
|---|---|---|---|---|---|---|---|---|
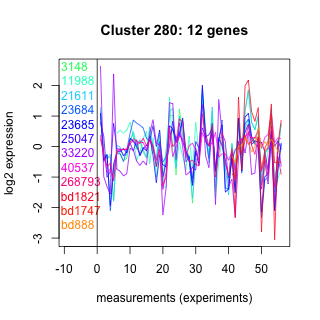
| Thaps_hclust_0280 |
 |
 |
0.75 |
0.64 |
81 |
exponential_vs_stationary_24highlight | 0.013300 | 0.341 |
| Title | Cluster Plot | Dendrogram | e-value | e-value | e-value | Condition | Condition FDR | Condition Difference |
|---|---|---|---|---|---|---|---|---|
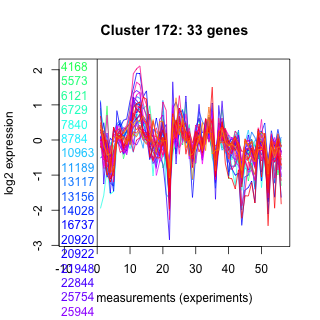
| Thaps_hclust_0172 |
 |
 |
0.000001 |
0.000011 |
0.014 |
lowtemp_TMEVA | 0.013400 | -0.5 |
| Title | Cluster Plot | Dendrogram | e-value | e-value | e-value | Condition | Condition FDR | Condition Difference |
|---|---|---|---|---|---|---|---|---|
| Thaps_hclust_0019 |
 |
 |
0.0000001 |
0.00000017 |
0.000037 |
highpH_TMEVA | 0.013400 | 0.36 |
| Title | Cluster Plot | Dendrogram | e-value | e-value | e-value | Condition | Condition FDR | Condition Difference |
|---|---|---|---|---|---|---|---|---|
| Thaps_hclust_0465 |
 |
 |
0.011 |
0.053 |
0.75 |
lowtemp_TMEVA | 0.013400 | -0.508 |
| Title | Cluster Plot | Dendrogram | e-value | e-value | e-value | Condition | Condition FDR | Condition Difference |
|---|---|---|---|---|---|---|---|---|
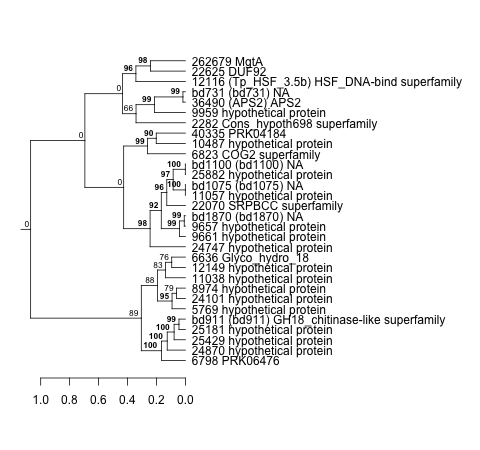
| Thaps_hclust_0228 |
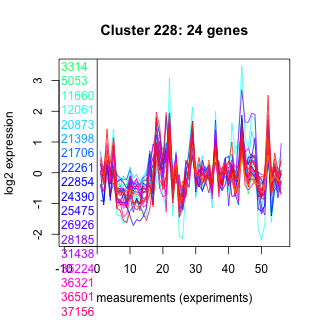 |
 |
0.00000000000028 |
0.0027 |
0.016 |
BaP | 0.013400 | 0.482 |
| Title | Cluster Plot | Dendrogram | e-value | e-value | e-value | Condition | Condition FDR | Condition Difference |
|---|---|---|---|---|---|---|---|---|
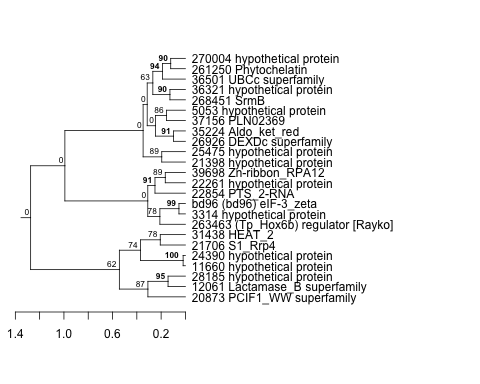
| Thaps_hclust_0345 |
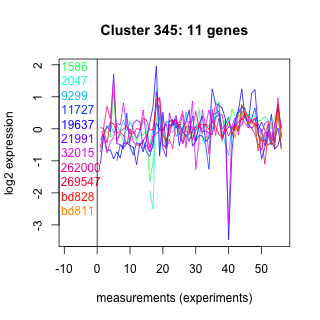 |
 |
1.1 |
7 |
2.7 |
lowFe_KTKB_Day3 | 0.013500 | -0.766 |