Thaps_hclust_0166 Hierarchical Clustering
Thalassiosira pseudonana
| Cluster Plot | Conditions Plot | Dendrogram |
|---|---|---|
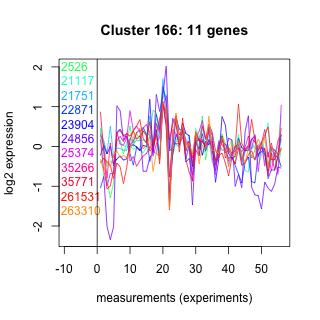 |
 |
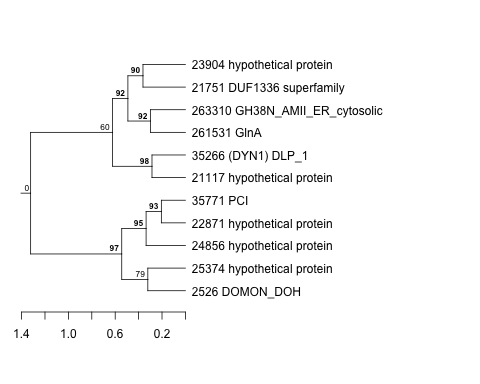 |
| GO ID | Go Term | p-value | q-value | Cluster |
|---|---|---|---|---|
| GO:0006584 | catecholamine metabolism | 0.00495406 | 1 | Thaps_hclust_0166 |
| GO:0006807 | nitrogen compound metabolism | 0.0135745 | 1 | Thaps_hclust_0166 |
| GO:0006298 | mismatch repair | 0.0196937 | 1 | Thaps_hclust_0166 |
| GO:0015986 | ATP synthesis coupled proton transport | 0.0557488 | 1 | Thaps_hclust_0166 |
| GO:0006464 | protein modification | 0.0710257 | 1 | Thaps_hclust_0166 |
| GO:0005975 | carbohydrate metabolism | 0.0895448 | 1 | Thaps_hclust_0166 |
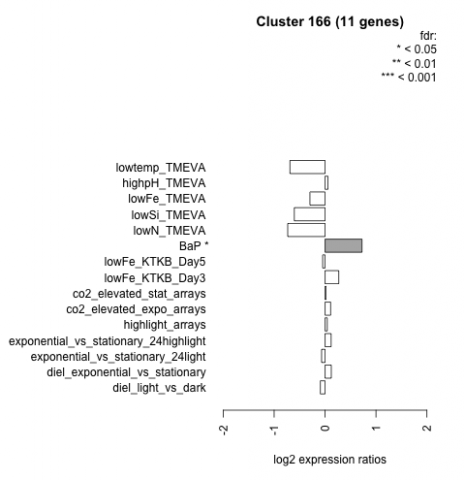
| Condition | Condition | Difference | FDR |
|---|---|---|---|
| diel_light_vs_dark | diel_light_vs_dark | -0.093 | 0.799 |
| lowFe_KTKB_Day3 | lowFe_KTKB_Day3 | 0.269 | 0.419 |
| lowFe_KTKB_Day5 | lowFe_KTKB_Day5 | -0.047 | 0.872 |
| BaP | BaP | 0.725 | 0.0132 |
| exponential_vs_stationary_24highlight | exponential_vs_stationary_24highlight | 0.119 | 0.428 |
| co2_elevated_stat_arrays | co2_elevated_stat_arrays | 0.020 | 0.949 |
| lowtemp_TMEVA | lowtemp_TMEVA | -0.689 | 0.052 |
| highpH_TMEVA | highpH_TMEVA | 0.056 | 0.828 |
| co2_elevated_expo_arrays | co2_elevated_expo_arrays | 0.110 | 0.732 |
| lowFe_TMEVA | lowFe_TMEVA | -0.297 | 0.383 |
| exponential_vs_stationary_24light | exponential_vs_stationary_24light | -0.068 | 0.898 |
| lowN_TMEVA | lowN_TMEVA | -0.733 | 0.0775 |
| diel_exponential_vs_stationary | diel_exponential_vs_stationary | 0.122 | 0.649 |
| lowSi_TMEVA | lowSi_TMEVA | -0.604 | 0.314 |
| highlight_arrays | highlight_arrays | 0.043 | 0.856 |