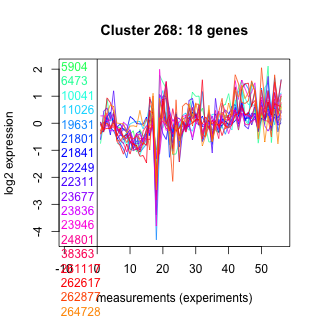
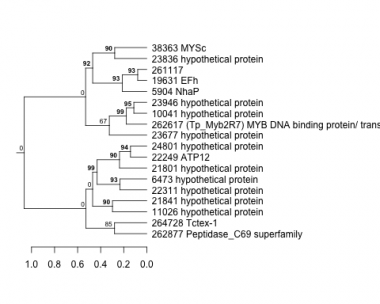
Thaps_hclust_0268 Hierarchical Clustering
Thalassiosira pseudonana
| GO ID | Go Term | p-value | q-value | Cluster |
|---|---|---|---|---|
| GO:0006885 | regulation of pH | 0.00247934 | 1 | Thaps_hclust_0268 |
| GO:0006814 | sodium ion transport | 0.00906837 | 1 | Thaps_hclust_0268 |
| GO:0044267 | cellular protein metabolism | 0.0115308 | 1 | Thaps_hclust_0268 |
| GO:0006508 | proteolysis and peptidolysis | 0.217787 | 1 | Thaps_hclust_0268 |
|
5904 : NhaP |
21801 : hypothetical protein |
23836 : hypothetical protein |
261117 : |
|
6473 : hypothetical protein |
21841 : hypothetical protein |
23946 : hypothetical protein |
262617 : (Tp_Myb2R7) MYB DNA binding protein/ transcription factor-like protein |
|
10041 : hypothetical protein |
22249 : ATP12 |
24801 : hypothetical protein |
262877 : Peptidase_C69 superfamily |
|
11026 : hypothetical protein |
22311 : hypothetical protein |
38363 : MYSc |
264728 : Tctex-1 |
|
19631 : EFh |
23677 : hypothetical protein |
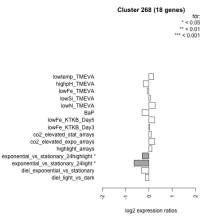
| Condition | Condition | Difference | FDR |
|---|---|---|---|
| diel_light_vs_dark | diel_light_vs_dark | -0.153 | 0.557 |
| lowFe_KTKB_Day3 | lowFe_KTKB_Day3 | 0.037 | 0.921 |
| lowFe_KTKB_Day5 | lowFe_KTKB_Day5 | 0.232 | 0.283 |
| BaP | BaP | -0.293 | 0.209 |
| exponential_vs_stationary_24highlight | exponential_vs_stationary_24highlight | -0.287 | 0.0106 |
| co2_elevated_stat_arrays | co2_elevated_stat_arrays | 0.105 | 0.701 |
| lowtemp_TMEVA | lowtemp_TMEVA | 0.206 | 0.445 |
| highpH_TMEVA | highpH_TMEVA | -0.240 | 0.148 |
| co2_elevated_expo_arrays | co2_elevated_expo_arrays | 0.251 | 0.0883 |
| lowFe_TMEVA | lowFe_TMEVA | -0.067 | 0.869 |
| exponential_vs_stationary_24light | exponential_vs_stationary_24light | -0.638 | 0.05 |
| lowN_TMEVA | lowN_TMEVA | 0.273 | 0.459 |
| diel_exponential_vs_stationary | diel_exponential_vs_stationary | -0.309 | 0.0961 |
| lowSi_TMEVA | lowSi_TMEVA | 0.054 | 1 |
| highlight_arrays | highlight_arrays | 0.128 | 0.483 |


