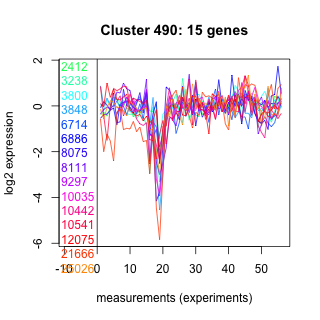
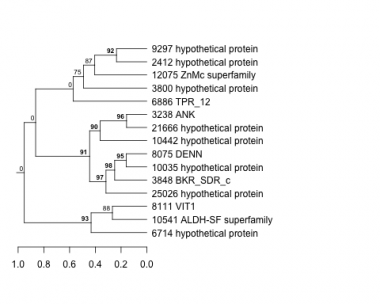
Thaps_hclust_0490 Hierarchical Clustering
Thalassiosira pseudonana
| GO ID | Go Term | p-value | q-value | Cluster |
|---|---|---|---|---|
| GO:0006573 | valine metabolism | 0.00495406 | 1 | Thaps_hclust_0490 |
| GO:0000074 | regulation of cell cycle | 0.0721923 | 1 | Thaps_hclust_0490 |
| GO:0008152 | metabolism | 0.0844211 | 1 | Thaps_hclust_0490 |
| GO:0005975 | carbohydrate metabolism | 0.0895448 | 1 | Thaps_hclust_0490 |
| GO:0006508 | proteolysis and peptidolysis | 0.308243 | 1 | Thaps_hclust_0490 |
|
2412 : hypothetical protein |
6714 : hypothetical protein |
9297 : hypothetical protein |
12075 : ZnMc superfamily |
|
3238 : ANK |
6886 : TPR_12 |
10035 : hypothetical protein |
21666 : hypothetical protein |
|
3800 : hypothetical protein |
8075 : DENN |
10442 : hypothetical protein |
25026 : hypothetical protein |
|
3848 : BKR_SDR_c |
8111 : VIT1 |
10541 : ALDH-SF superfamily |
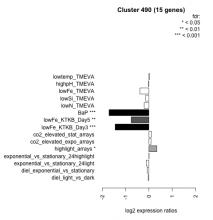
| Condition | Condition | Difference | FDR |
|---|---|---|---|
| diel_light_vs_dark | diel_light_vs_dark | -0.030 | 0.952 |
| lowFe_KTKB_Day3 | lowFe_KTKB_Day3 | -1.450 | 0.000862 |
| lowFe_KTKB_Day5 | lowFe_KTKB_Day5 | -0.758 | 0.00132 |
| BaP | BaP | -1.710 | 0.00037 |
| exponential_vs_stationary_24highlight | exponential_vs_stationary_24highlight | 0.008 | 0.967 |
| co2_elevated_stat_arrays | co2_elevated_stat_arrays | 0.111 | 0.697 |
| lowtemp_TMEVA | lowtemp_TMEVA | 0.034 | 0.927 |
| highpH_TMEVA | highpH_TMEVA | -0.014 | 0.965 |
| co2_elevated_expo_arrays | co2_elevated_expo_arrays | 0.092 | 0.771 |
| lowFe_TMEVA | lowFe_TMEVA | -0.386 | 0.212 |
| exponential_vs_stationary_24light | exponential_vs_stationary_24light | -0.113 | 0.807 |
| lowN_TMEVA | lowN_TMEVA | -0.203 | 0.613 |
| diel_exponential_vs_stationary | diel_exponential_vs_stationary | -0.069 | 0.781 |
| lowSi_TMEVA | lowSi_TMEVA | -0.139 | 0.976 |
| highlight_arrays | highlight_arrays | 0.343 | 0.0493 |


